Consolidated Accounting
Consolidated Accounting
Please scroll the table horizontally.
(Million JPY)
| Year Ended May 31, 2022 | Year Ended May 31, 2023 | Year Ending May 31, 2024 | Year Ending May 31, 2025 | Compared with the same period in the previous year |
Year Ending May 31, 2026 (Forecast) |
||
|---|---|---|---|---|---|---|---|
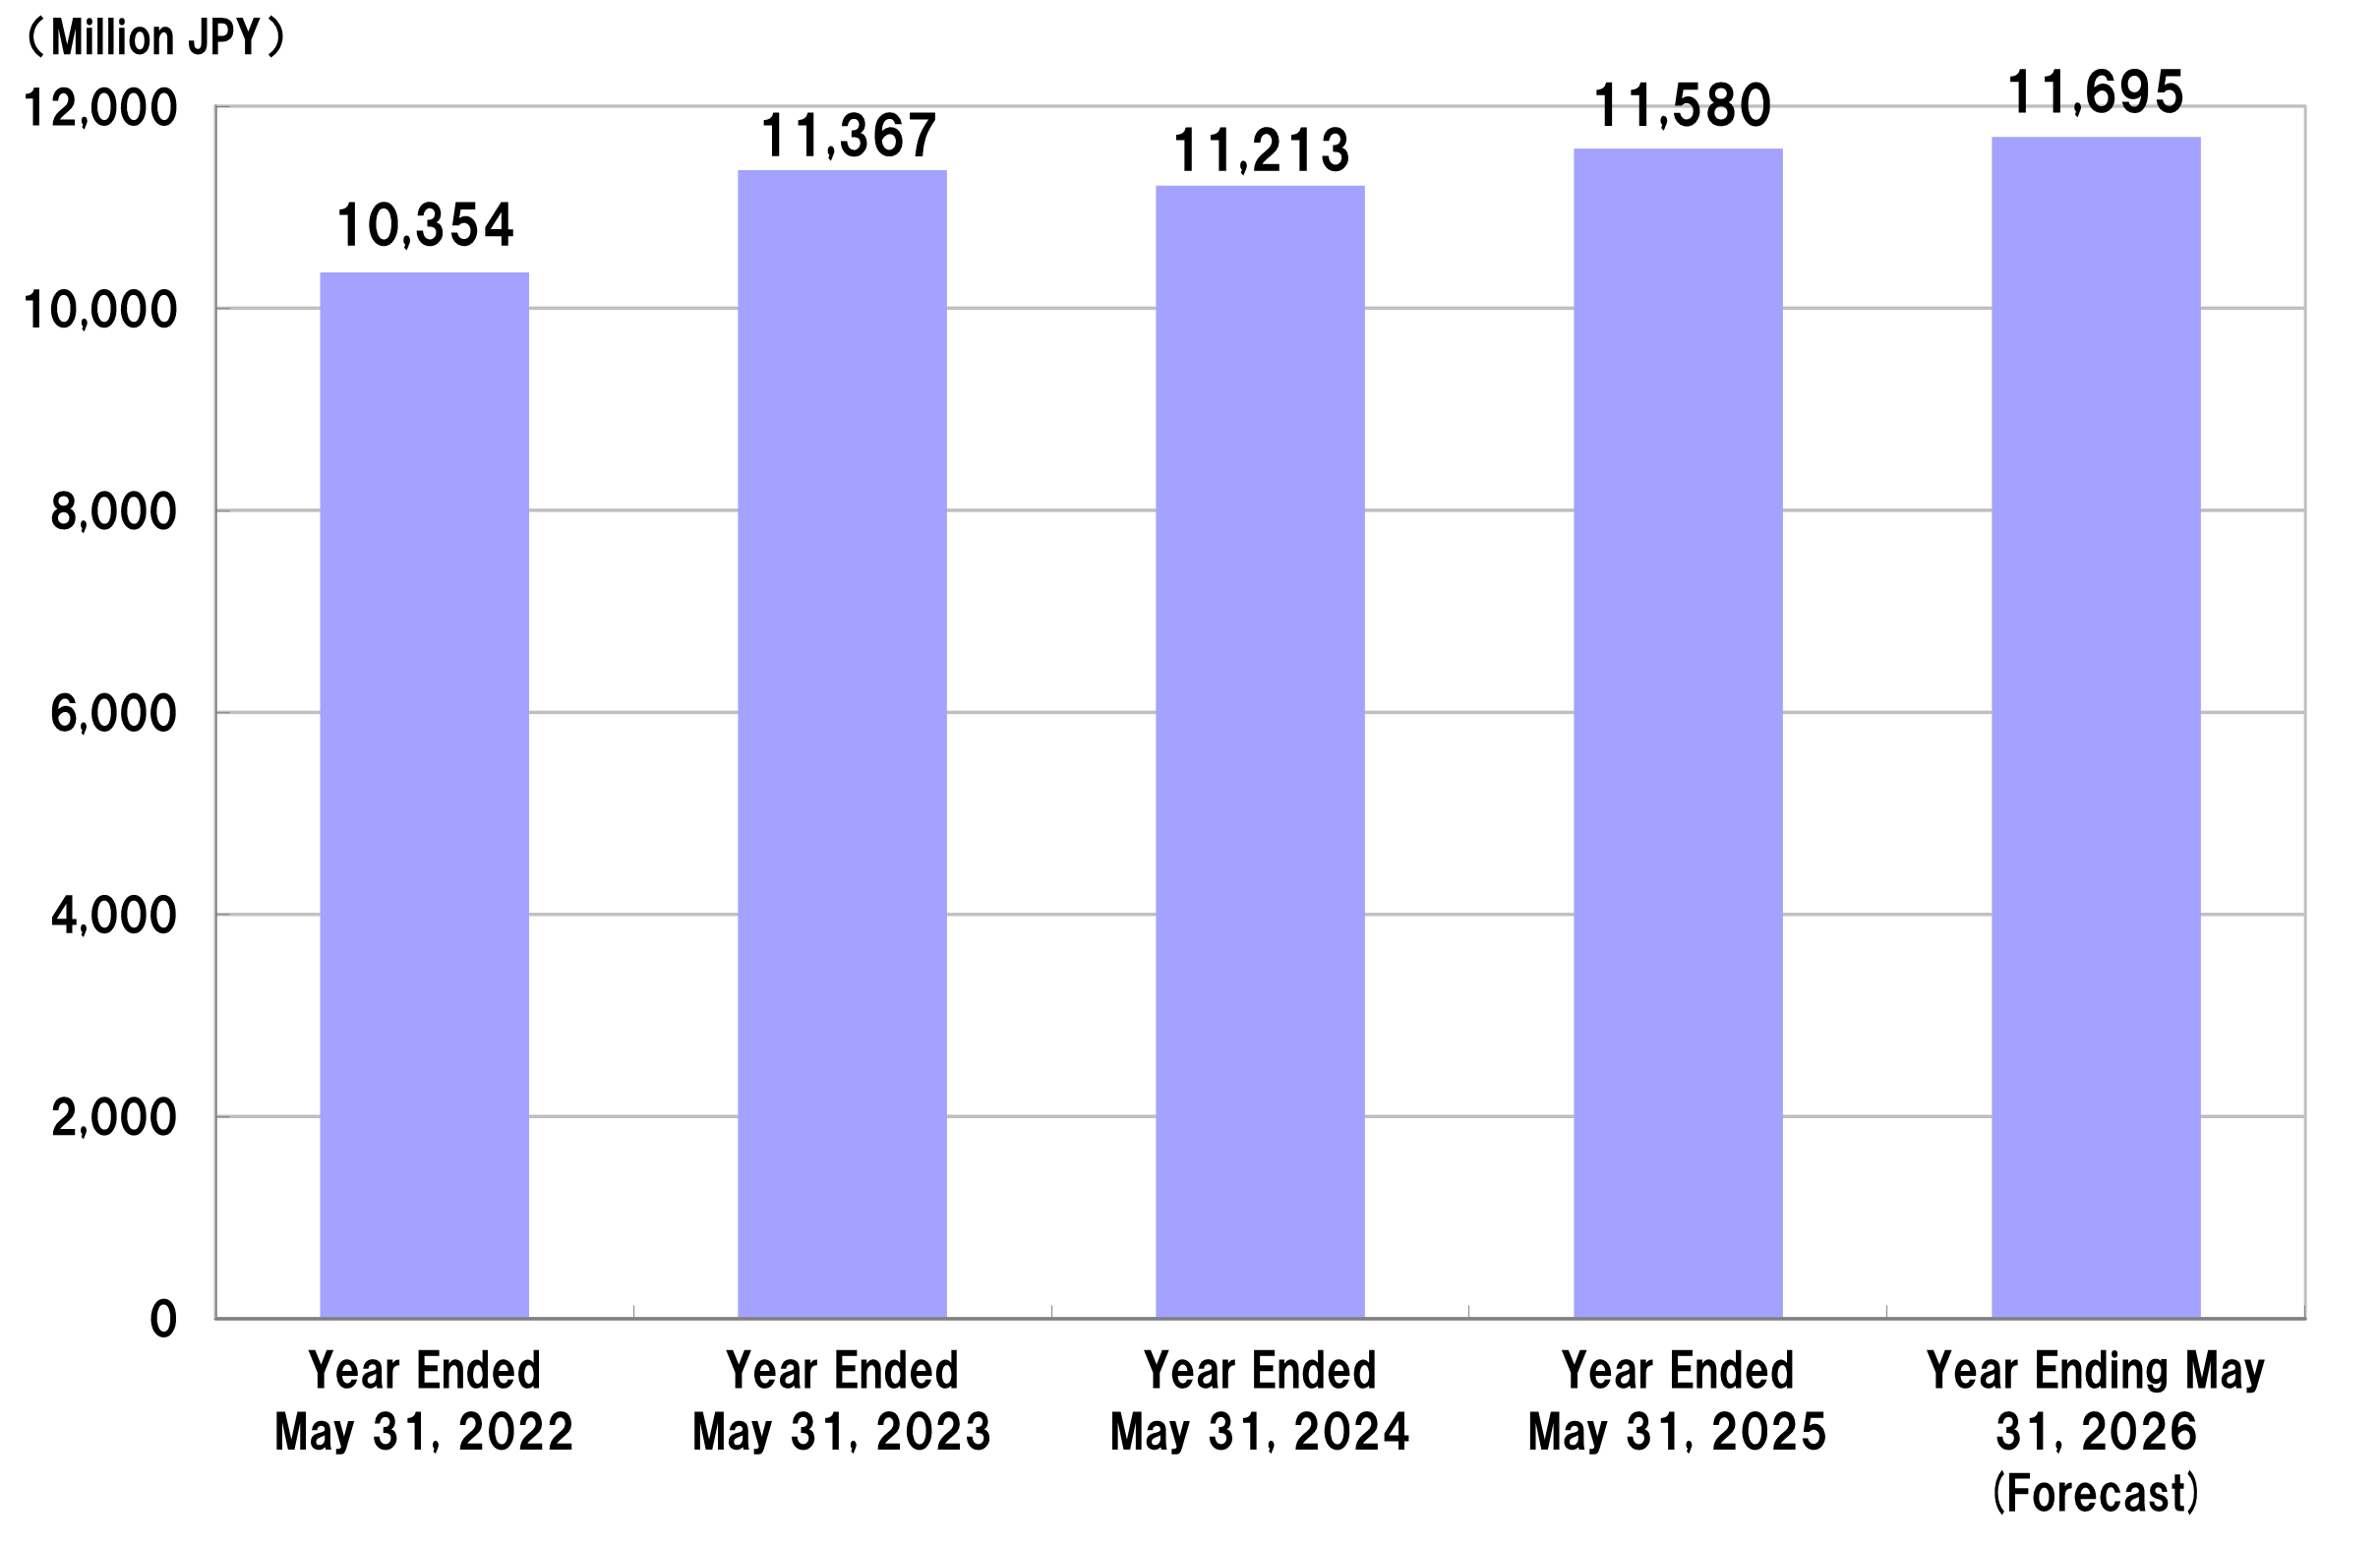
| Total Sales | 10,354 | 11,367 | 11,213 | 11,580 | 3.3% | 11,695 | |
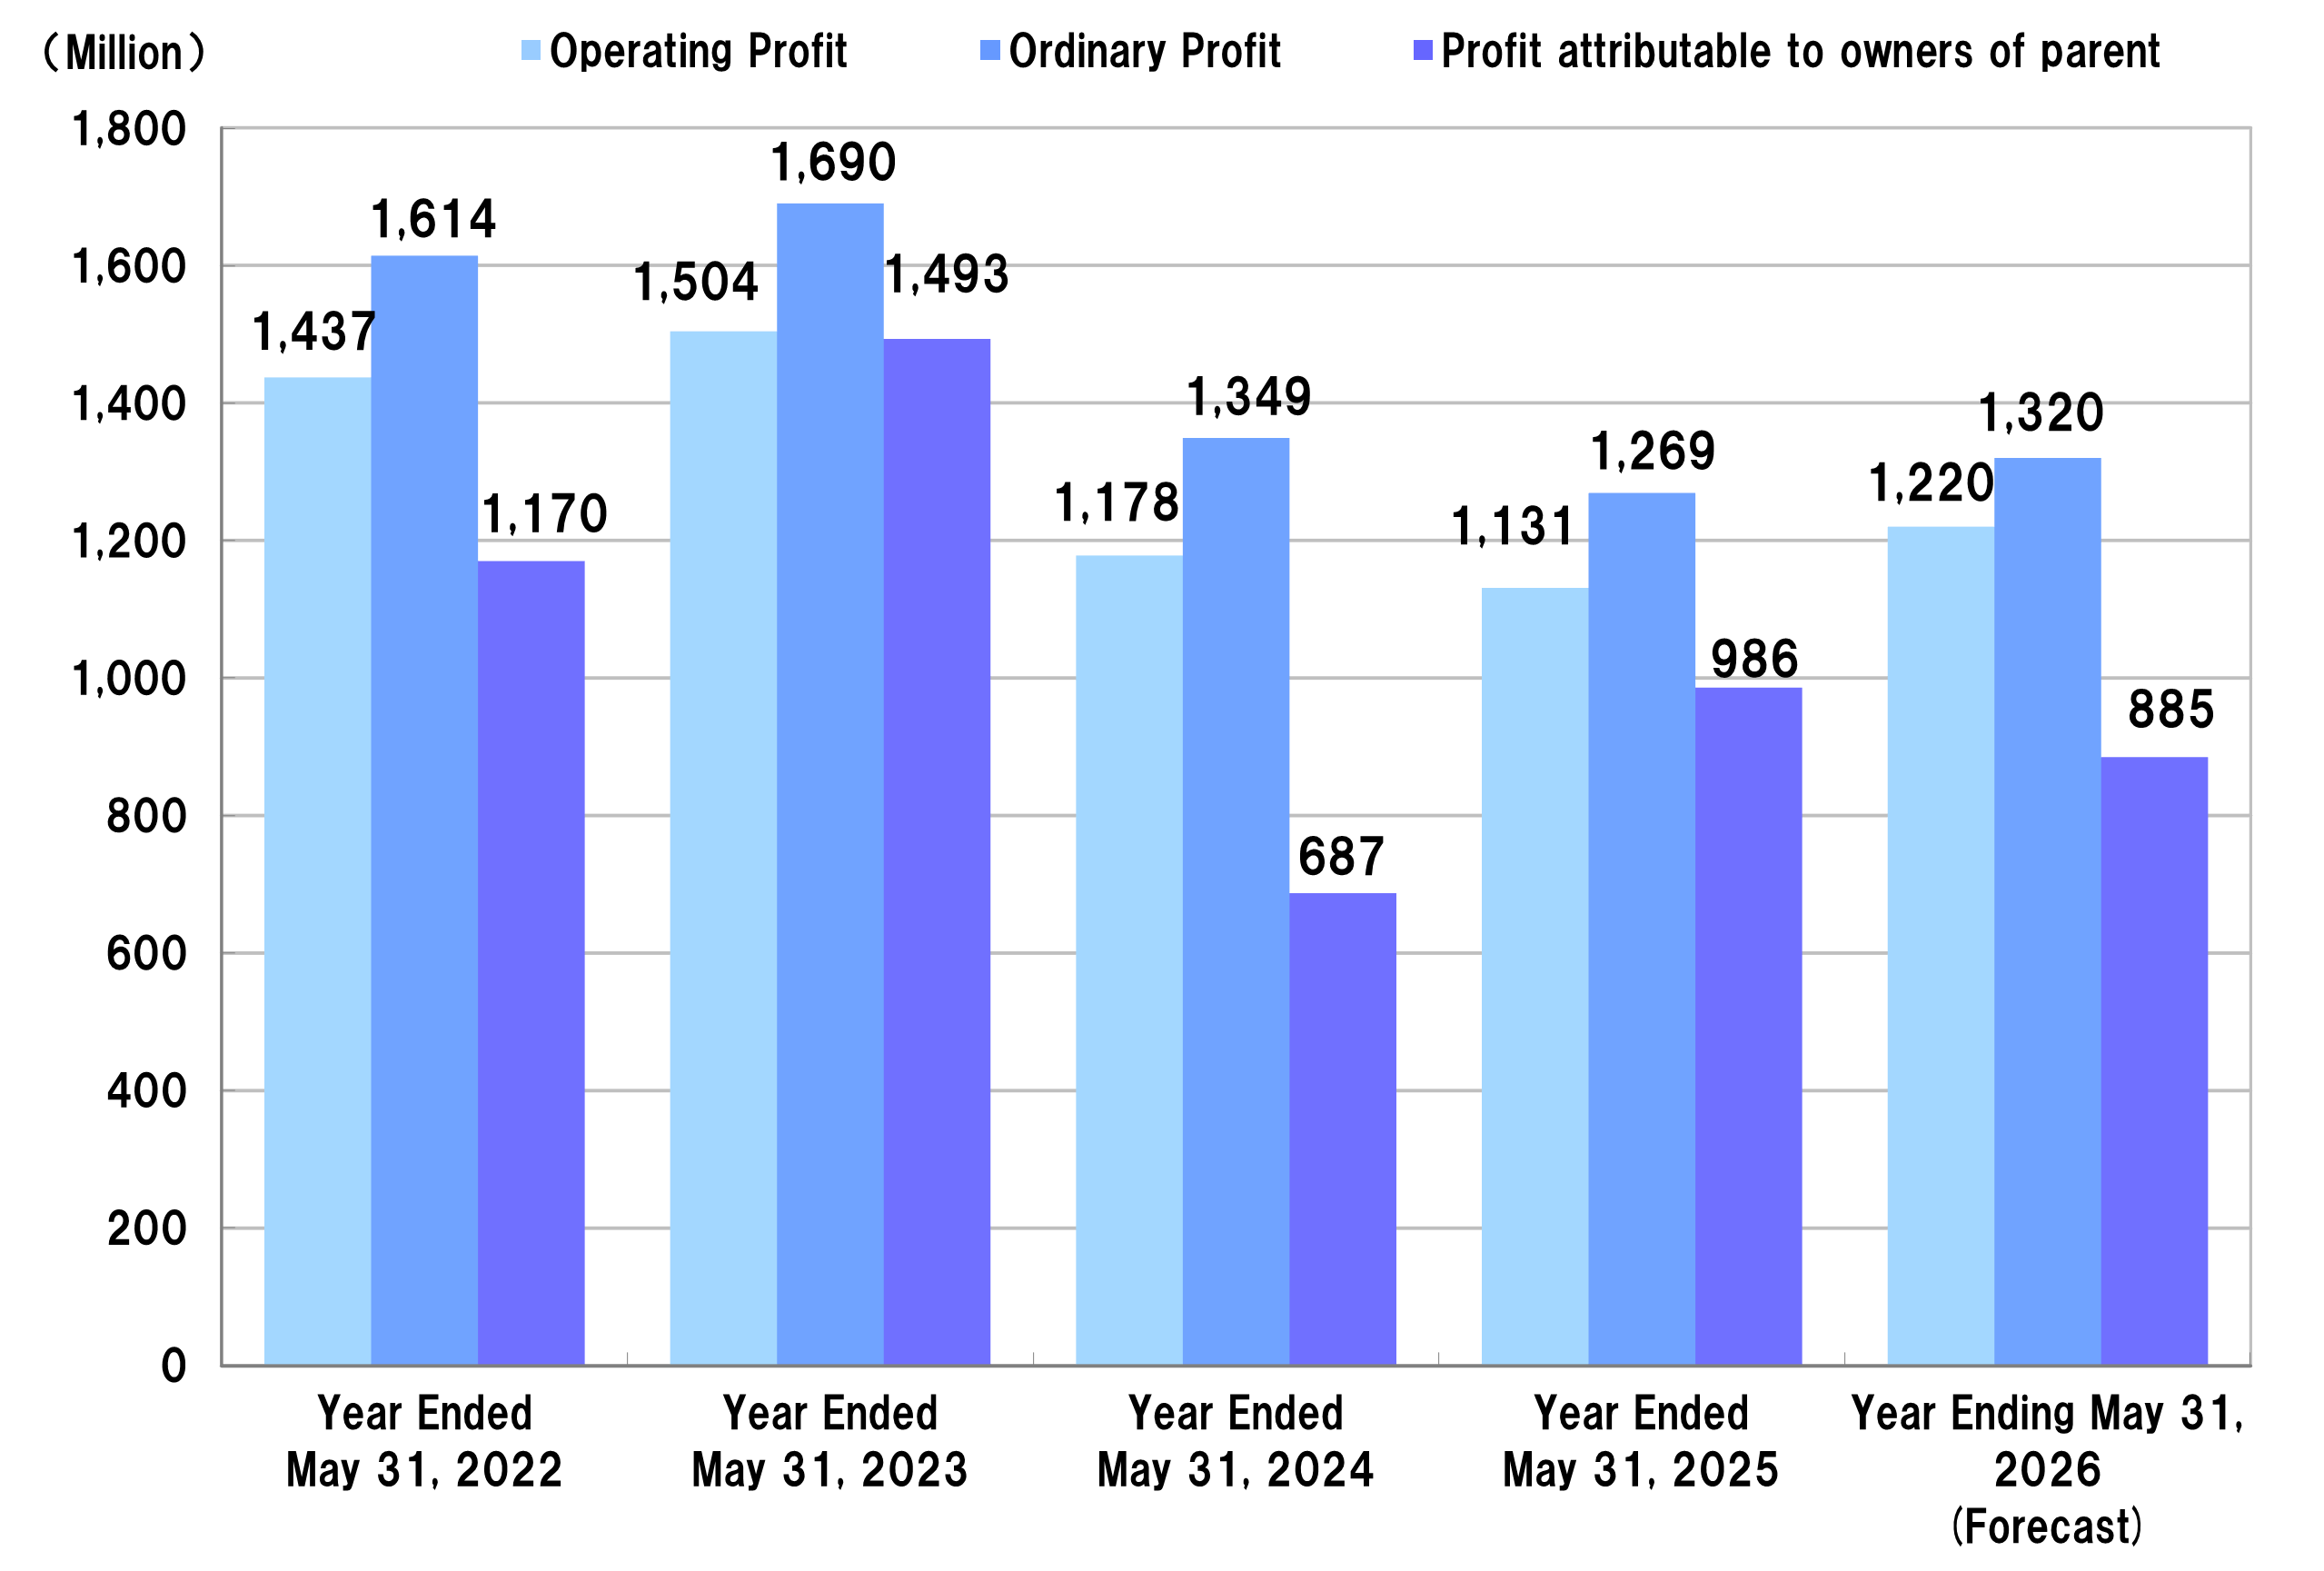
| Operating Profit | 1,437 | 1,504 | 1,178 | 1,131 | △4.0% | 1,220 | |
| Ordinary Profit | 1,614 | 1,690 | 1,349 | 1,269 | △5.9% | 1,320 | |
| Profit attributable to owners of parent | 1,170 | 1,493 | 687 | 986 | 43.5% | 885 | |
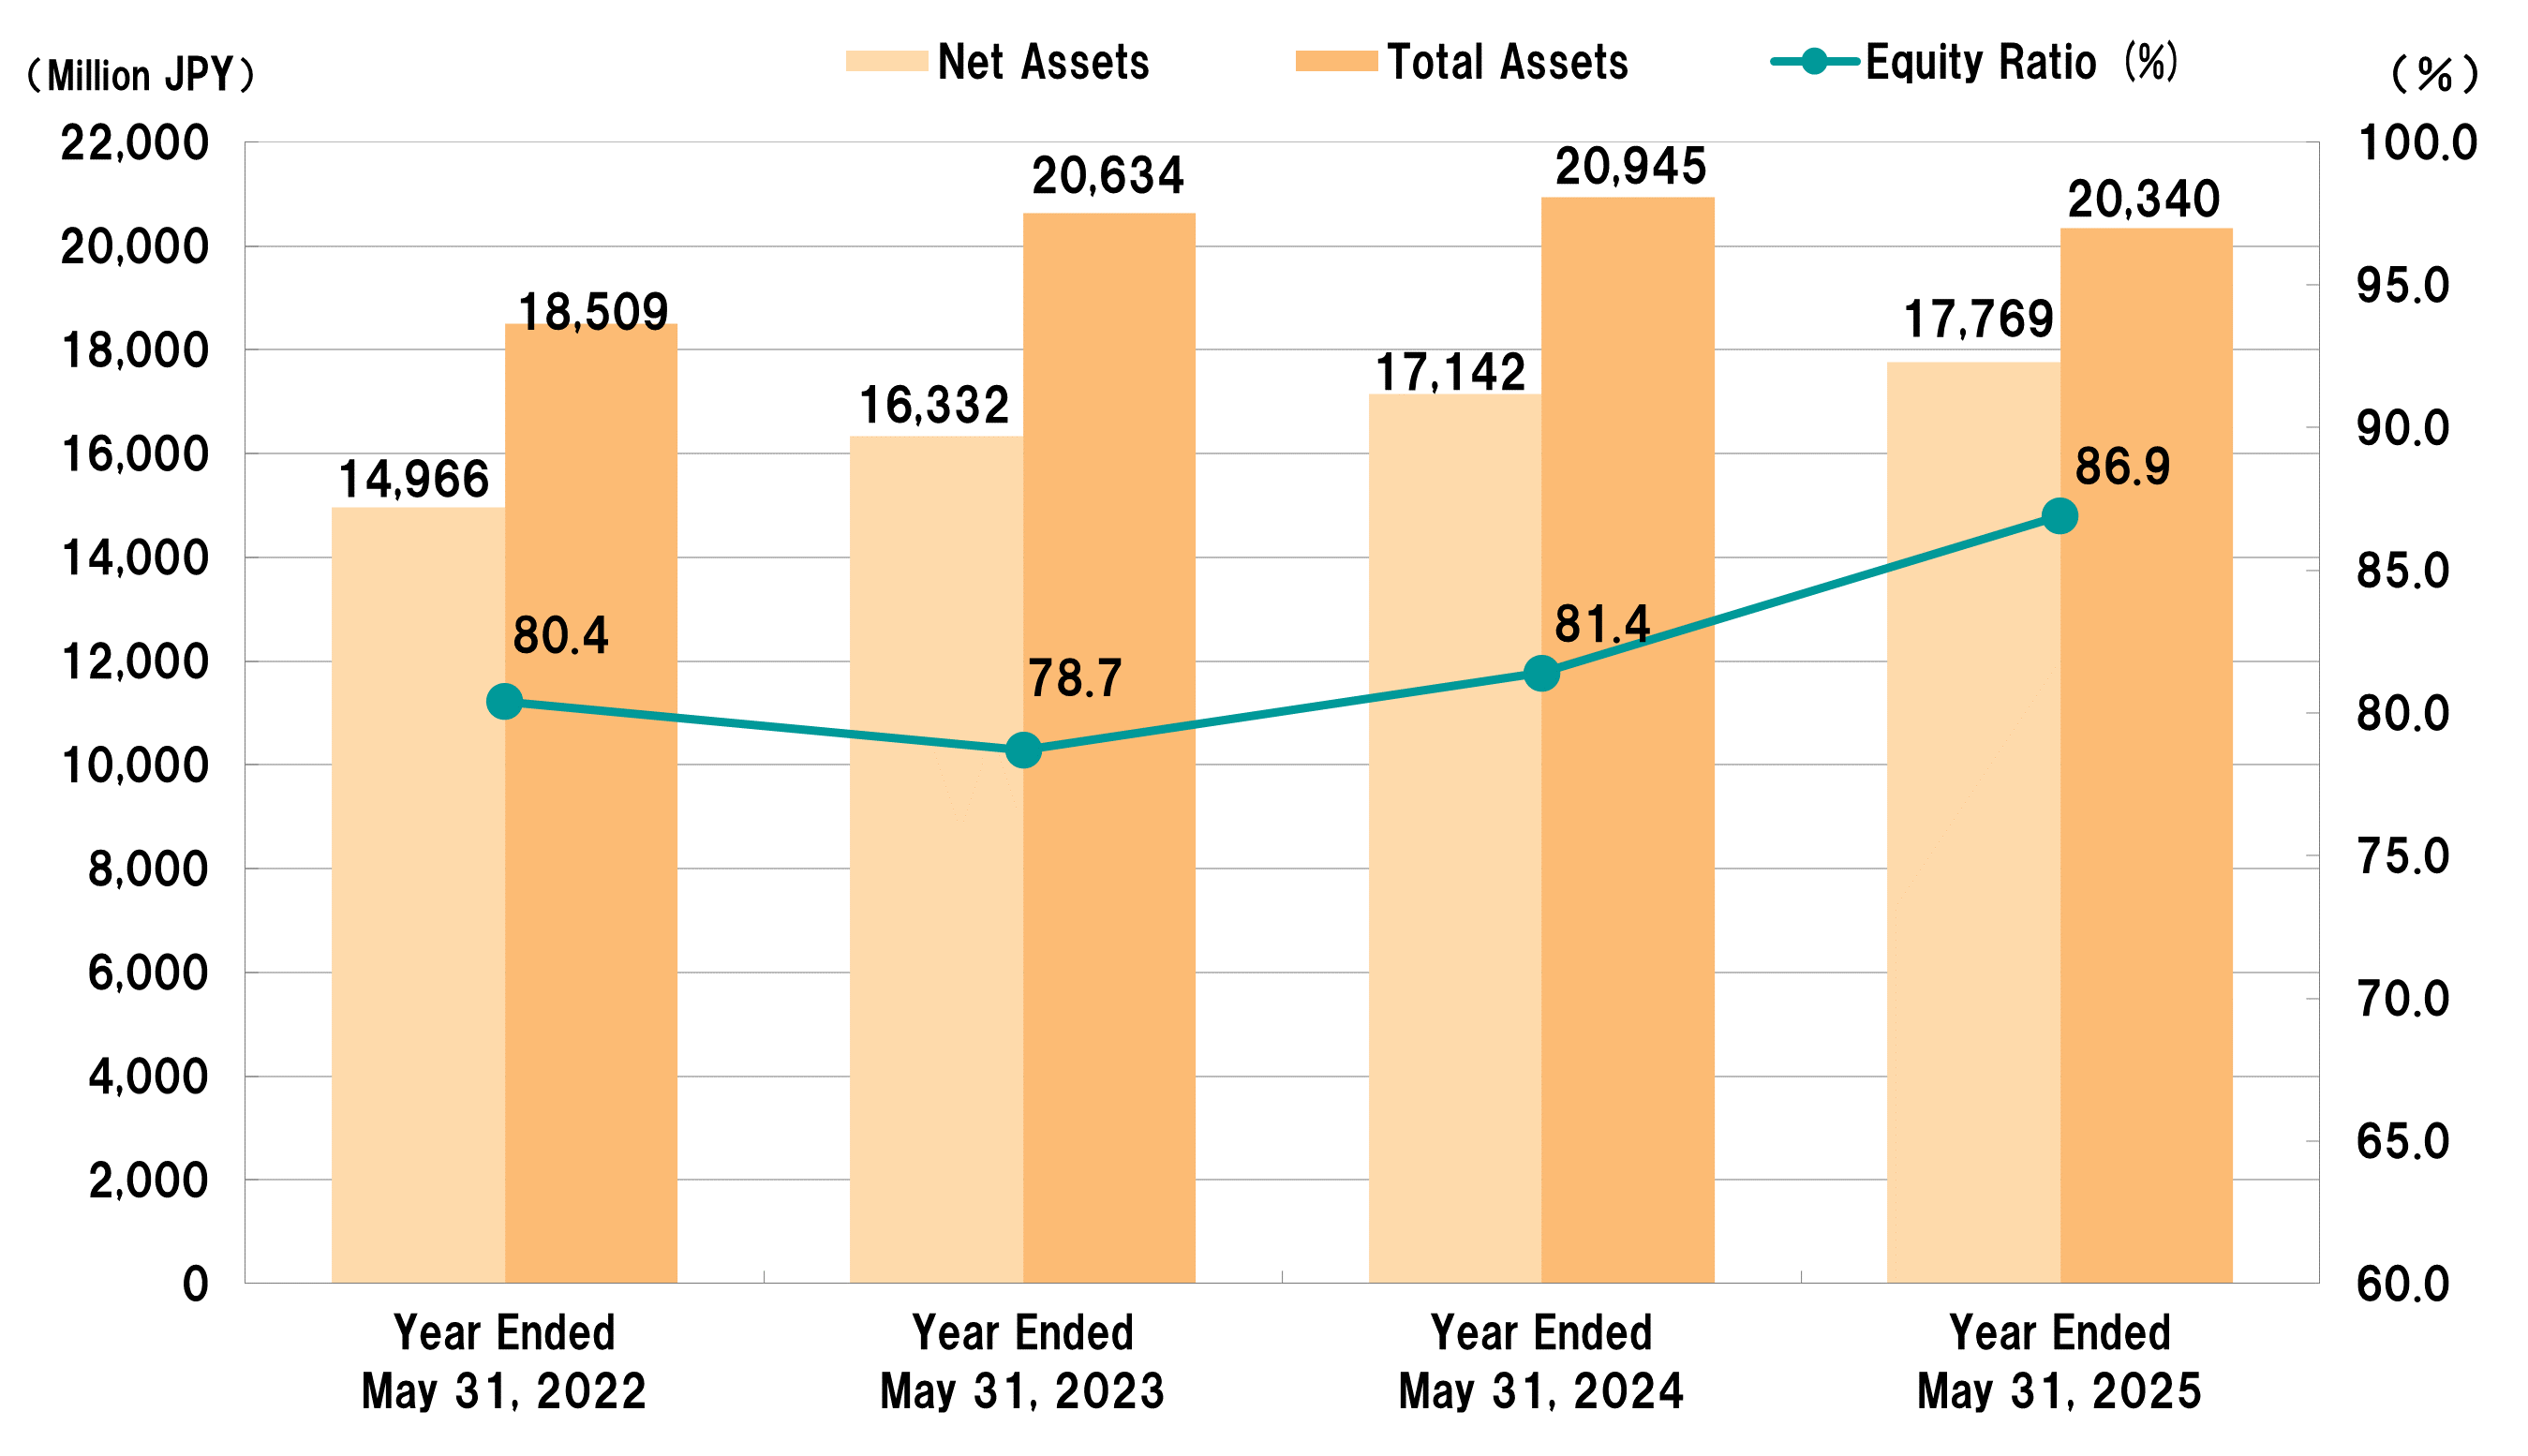
| Net Assets | 14,966 | 16,332 | 17,142 | 17,769 | 3.7% | – | |
| Total Assets | 18,509 | 20,634 | 20,945 | 20,340 | △2.9% | – | |
| Net Assets per Share of Common Stock(JPY) |
2,101.38 | 2,293.40 | 2,407.11 | 2,494.67 | – | – | |
| Net Income per Share of Common Stock (JPY) | 165.23 | 210.85 | 97.03 | 139.23 | – | 124.96 | |
| Equity Ratio(%) | 80.4 | 78.7 | 81.4 | 86.9 | – | – | |
| Return On Equity(%) | 8.2 | 9.6 | 4.1 | 5.7 | – | – | |
Please scroll the table horizontally.
| Compared with the same period in the previous year |
3 Months Ended May 31, 2026 (1st Quarter) |
3 Months Ended May 31, 2025 (1st Quarter) |
6 Months Ended May 31, 2026 (2nd Quarter) |
6 Months Ended May 31, 2025 (2nd Quarter) |
9 Months Ended May 31, 2026 (3rd Quarter) |
9 Months Ended May 31, 2025 (3rd Quarter) |
|
|---|---|---|---|---|---|---|---|
| Total Sales | (Million JPY) | 2,505 | 2,654 | 5,441 | 5,550 | 8,698 | |
| (%)※ | △5.6 | △5.3 | △2.0 | △2.7 | 3.7 | ||
| Operating Profit |
(Million JPY) | 152 | 212 | 526 | 553 | 874 | |
| (%)※ | △28.5 | △30.9 | △4.8 | △15.2 | △1.6 | ||
| Ordinary Profit |
(Million JPY) | 189 | 228 | 589 | 592 | 936 | |
| (%)※ | △17.0 | △38.4 | △0.7 | △20.0 | △6.1 | ||
| Quarterly Profit attributable to owners of parent |
(Million JPY) | 108 | 145 | 382 | 404 | 648 | |
| (%)※ | △25.6 | △42.1 | △5.3 | △21.1 | 7.1 | ||
※(Compared with the same period in the previous year)
Net Sales
Operating Profit / Ordinary Profit / Net Income
Net Assets / Total Assets / Equity Ratio