Consolidated Accounting
Consolidated Accounting
Please scroll the table horizontally.
(Million JPY)
| Year Ended May 31, 2023 | Year Ending May 31, 2024 | Year Ending May 31, 2025 | Year Ending May 31, 2026 | Compared with the same period in the previous year |
Year Ending May 31, 2027 (Forecast) |
||
|---|---|---|---|---|---|---|---|
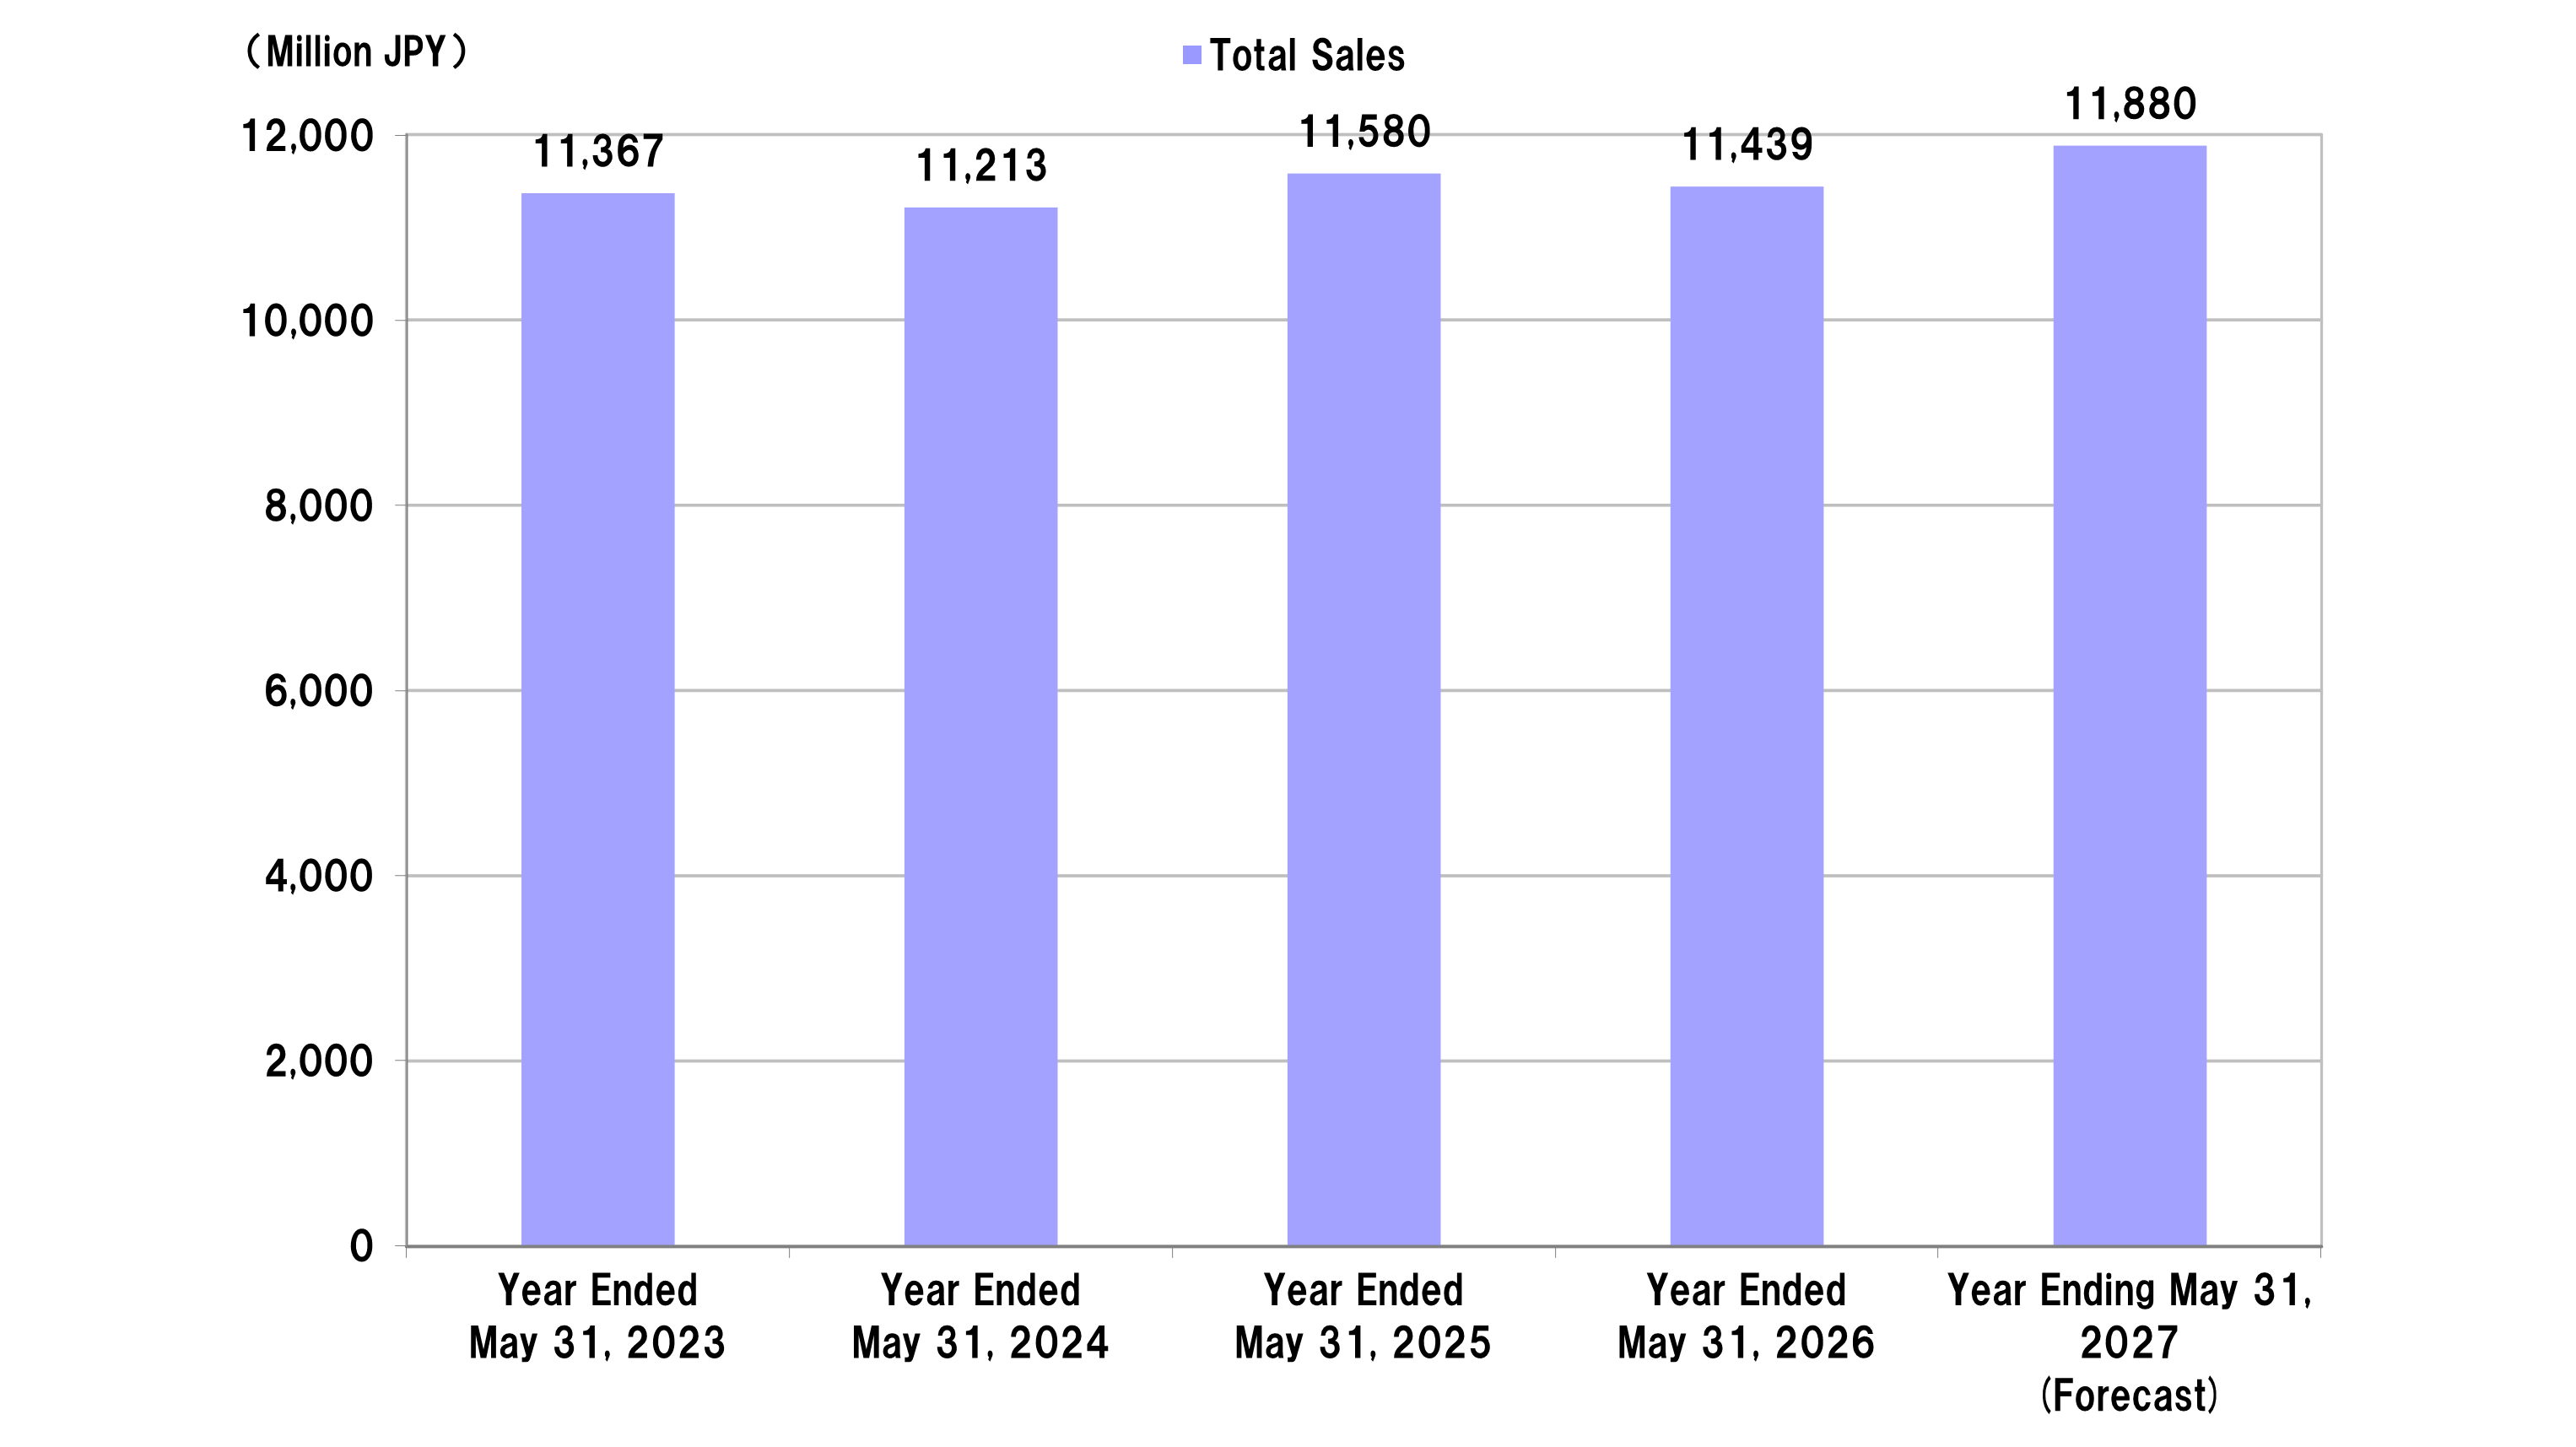
| Total Sales | 11,367 | 11,213 | 11,580 | 11,439 | △1.2% | 11,880 | |
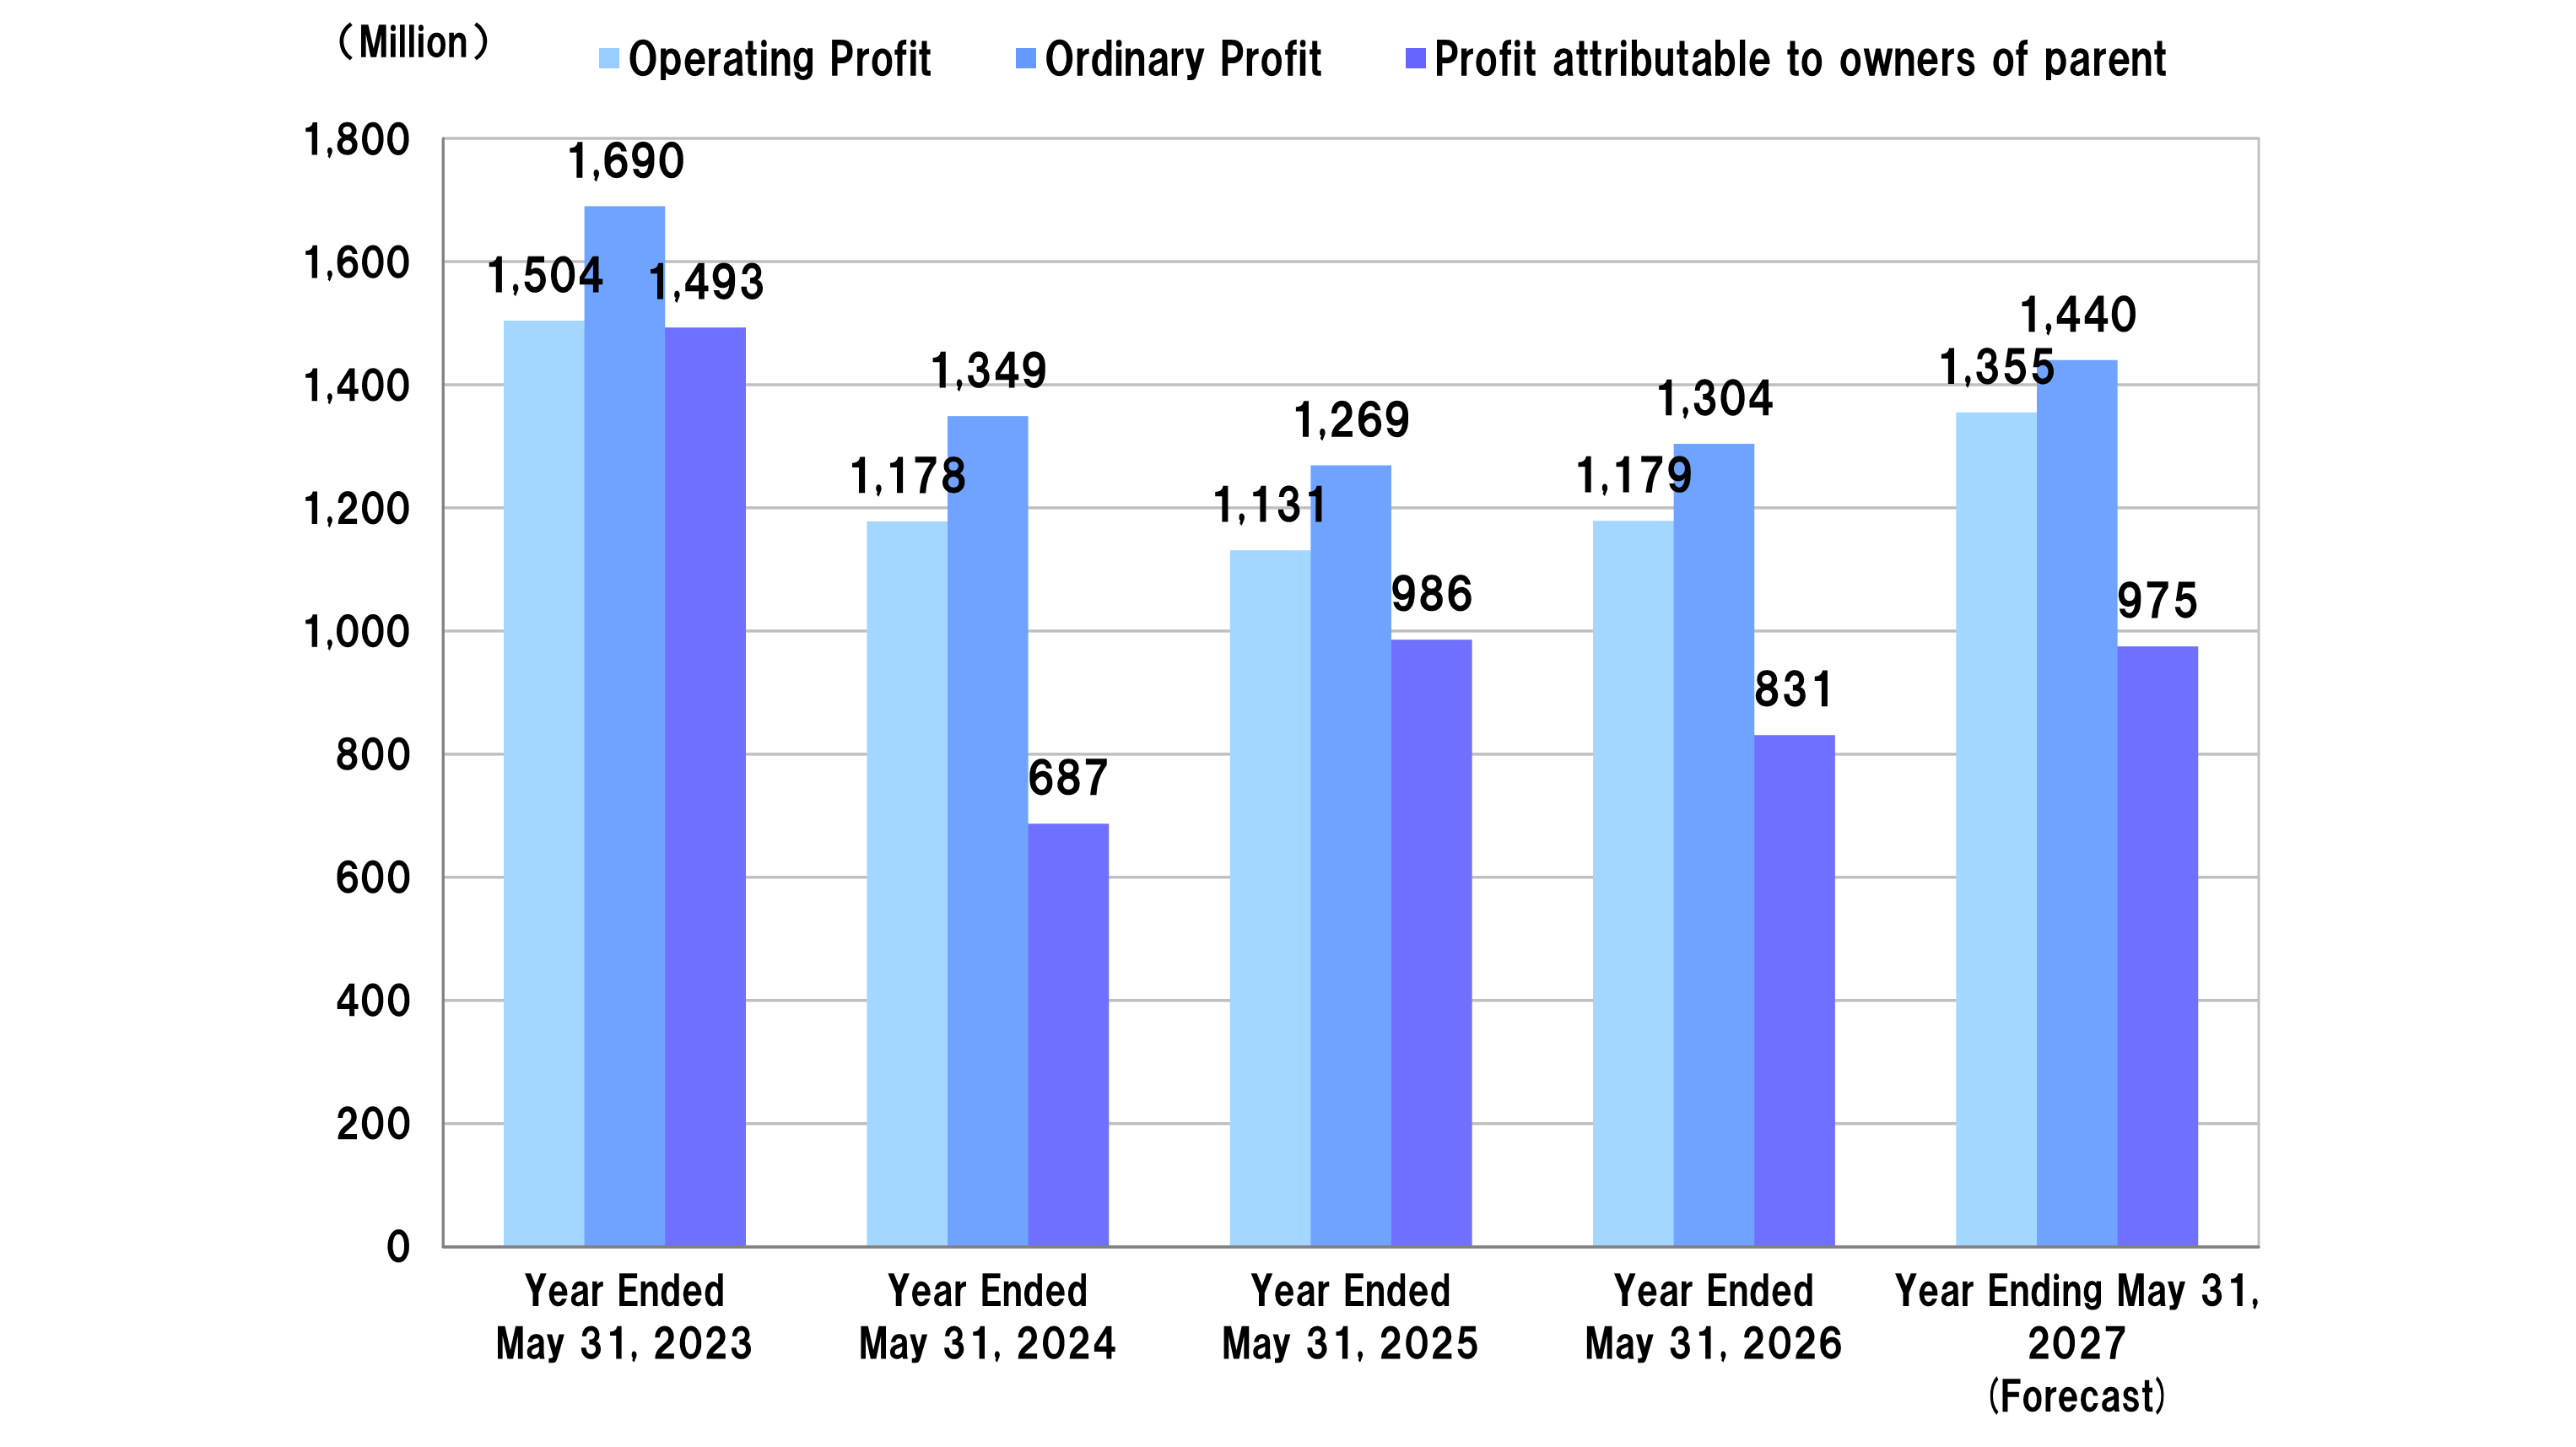
| Operating Profit | 1,504 | 1,178 | 1,131 | 1,179 | 4.3% | 1,355 | |
| Ordinary Profit | 1,690 | 1,349 | 1,269 | 1,304 | 2.8% | 1,440 | |
| Profit attributable to owners of parent | 1,493 | 687 | 986 | 831 | △15.7% | 975 | |
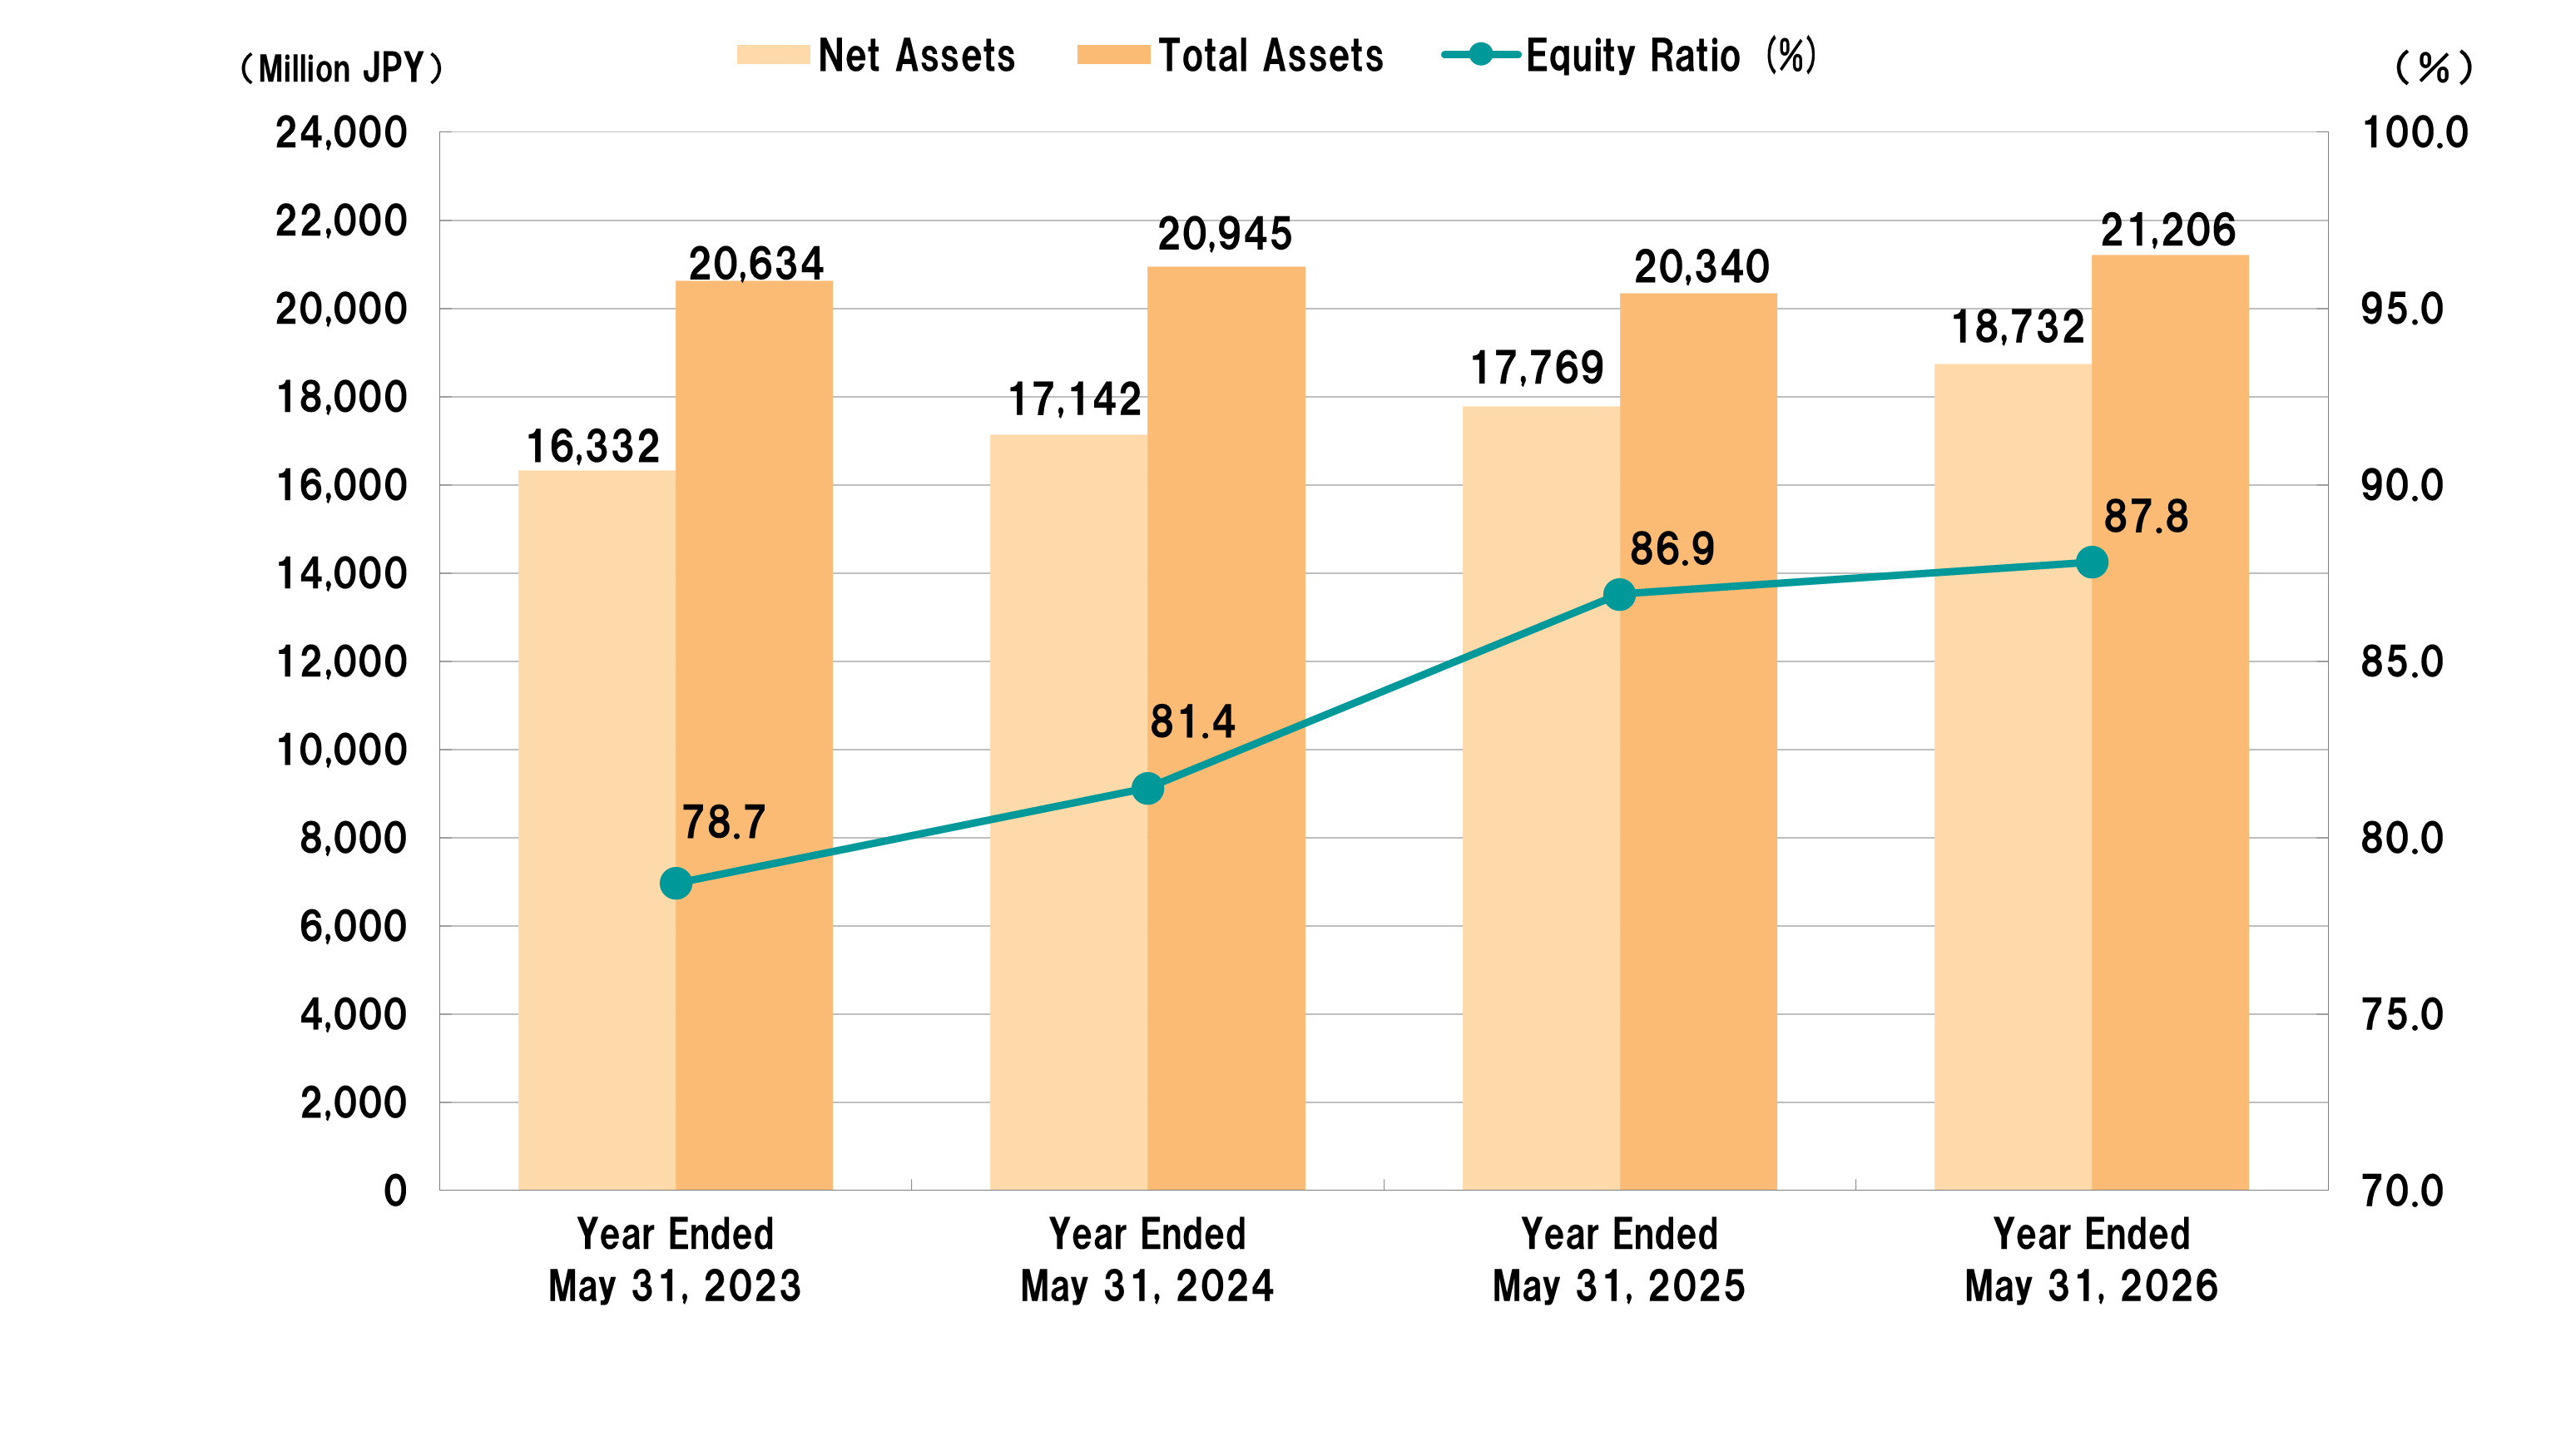
| Net Assets | 16,332 | 17,142 | 17,769 | 18,732 | 5.4% | – | |
| Total Assets | 20,634 | 20,945 | 20,340 | 21,206 | 4.3% | – | |
| Net Assets per Share of Common Stock(JPY) |
2,293.40 | 2,407.11 | 2,494.67 | 2,628.23 | – | – | |
| Net Income per Share of Common Stock (JPY) | 210.85 | 97.03 | 139.23 | 117.36 | – | 137.67 | |
| Equity Ratio(%) | 78.7 | 81.4 | 86.9 | 87.8 | – | – | |
| Return On Equity(%) | 9.6 | 4.1 | 5.7 | 4.6 | – | – | |
Please scroll the table horizontally.
| Compared with the same period in the previous year |
3 Months Ended May 31, 2027 (1st Quarter) |
3 Months Ended May 31, 2026 (1st Quarter) |
6 Months Ended May 31, 2027 (2nd Quarter) |
6 Months Ended May 31, 2026 (2nd Quarter) |
9 Months Ended May 31, 2027 (3rd Quarter) |
9 Months Ended May 31, 2026 (3rd Quarter) |
|
|---|---|---|---|---|---|---|---|
| Total Sales | (Million JPY) | 2,505 | 5,441 | 8,190 | |||
| (%)※ | △5.6 | △2.0 | △5.8 | ||||
| Operating Profit |
(Million JPY) | 152 | 526 | 756 | |||
| (%)※ | △28.5 | △4.8 | △13.5 | ||||
| Ordinary Profit |
(Million JPY) | 189 | 589 | 827 | |||
| (%)※ | △17.0 | △0.7 | △11.6 | ||||
| Quarterly Profit attributable to owners of parent |
(Million JPY) | 108 | 382 | 534 | |||
| (%)※ | △25.6 | △5.3 | △17.5 | ||||
※(Compared with the same period in the previous year)
Net Sales
Operating Profit / Ordinary Profit / Net Income
Net Assets / Total Assets / Equity Ratio