Non-Consolidated Accounting
Non-Consolidated Accounting
Please scroll the table horizontally.
(Million JPY)
| Year Ended May 31, 2023 | Year Ended May 31, 2024 | Year Ended May 31, 2025 | Year Ending May 31, 2026 | Compared with the same period in the previous year |
Year Ending May 31, 2027 (Forecast) |
||
|---|---|---|---|---|---|---|---|
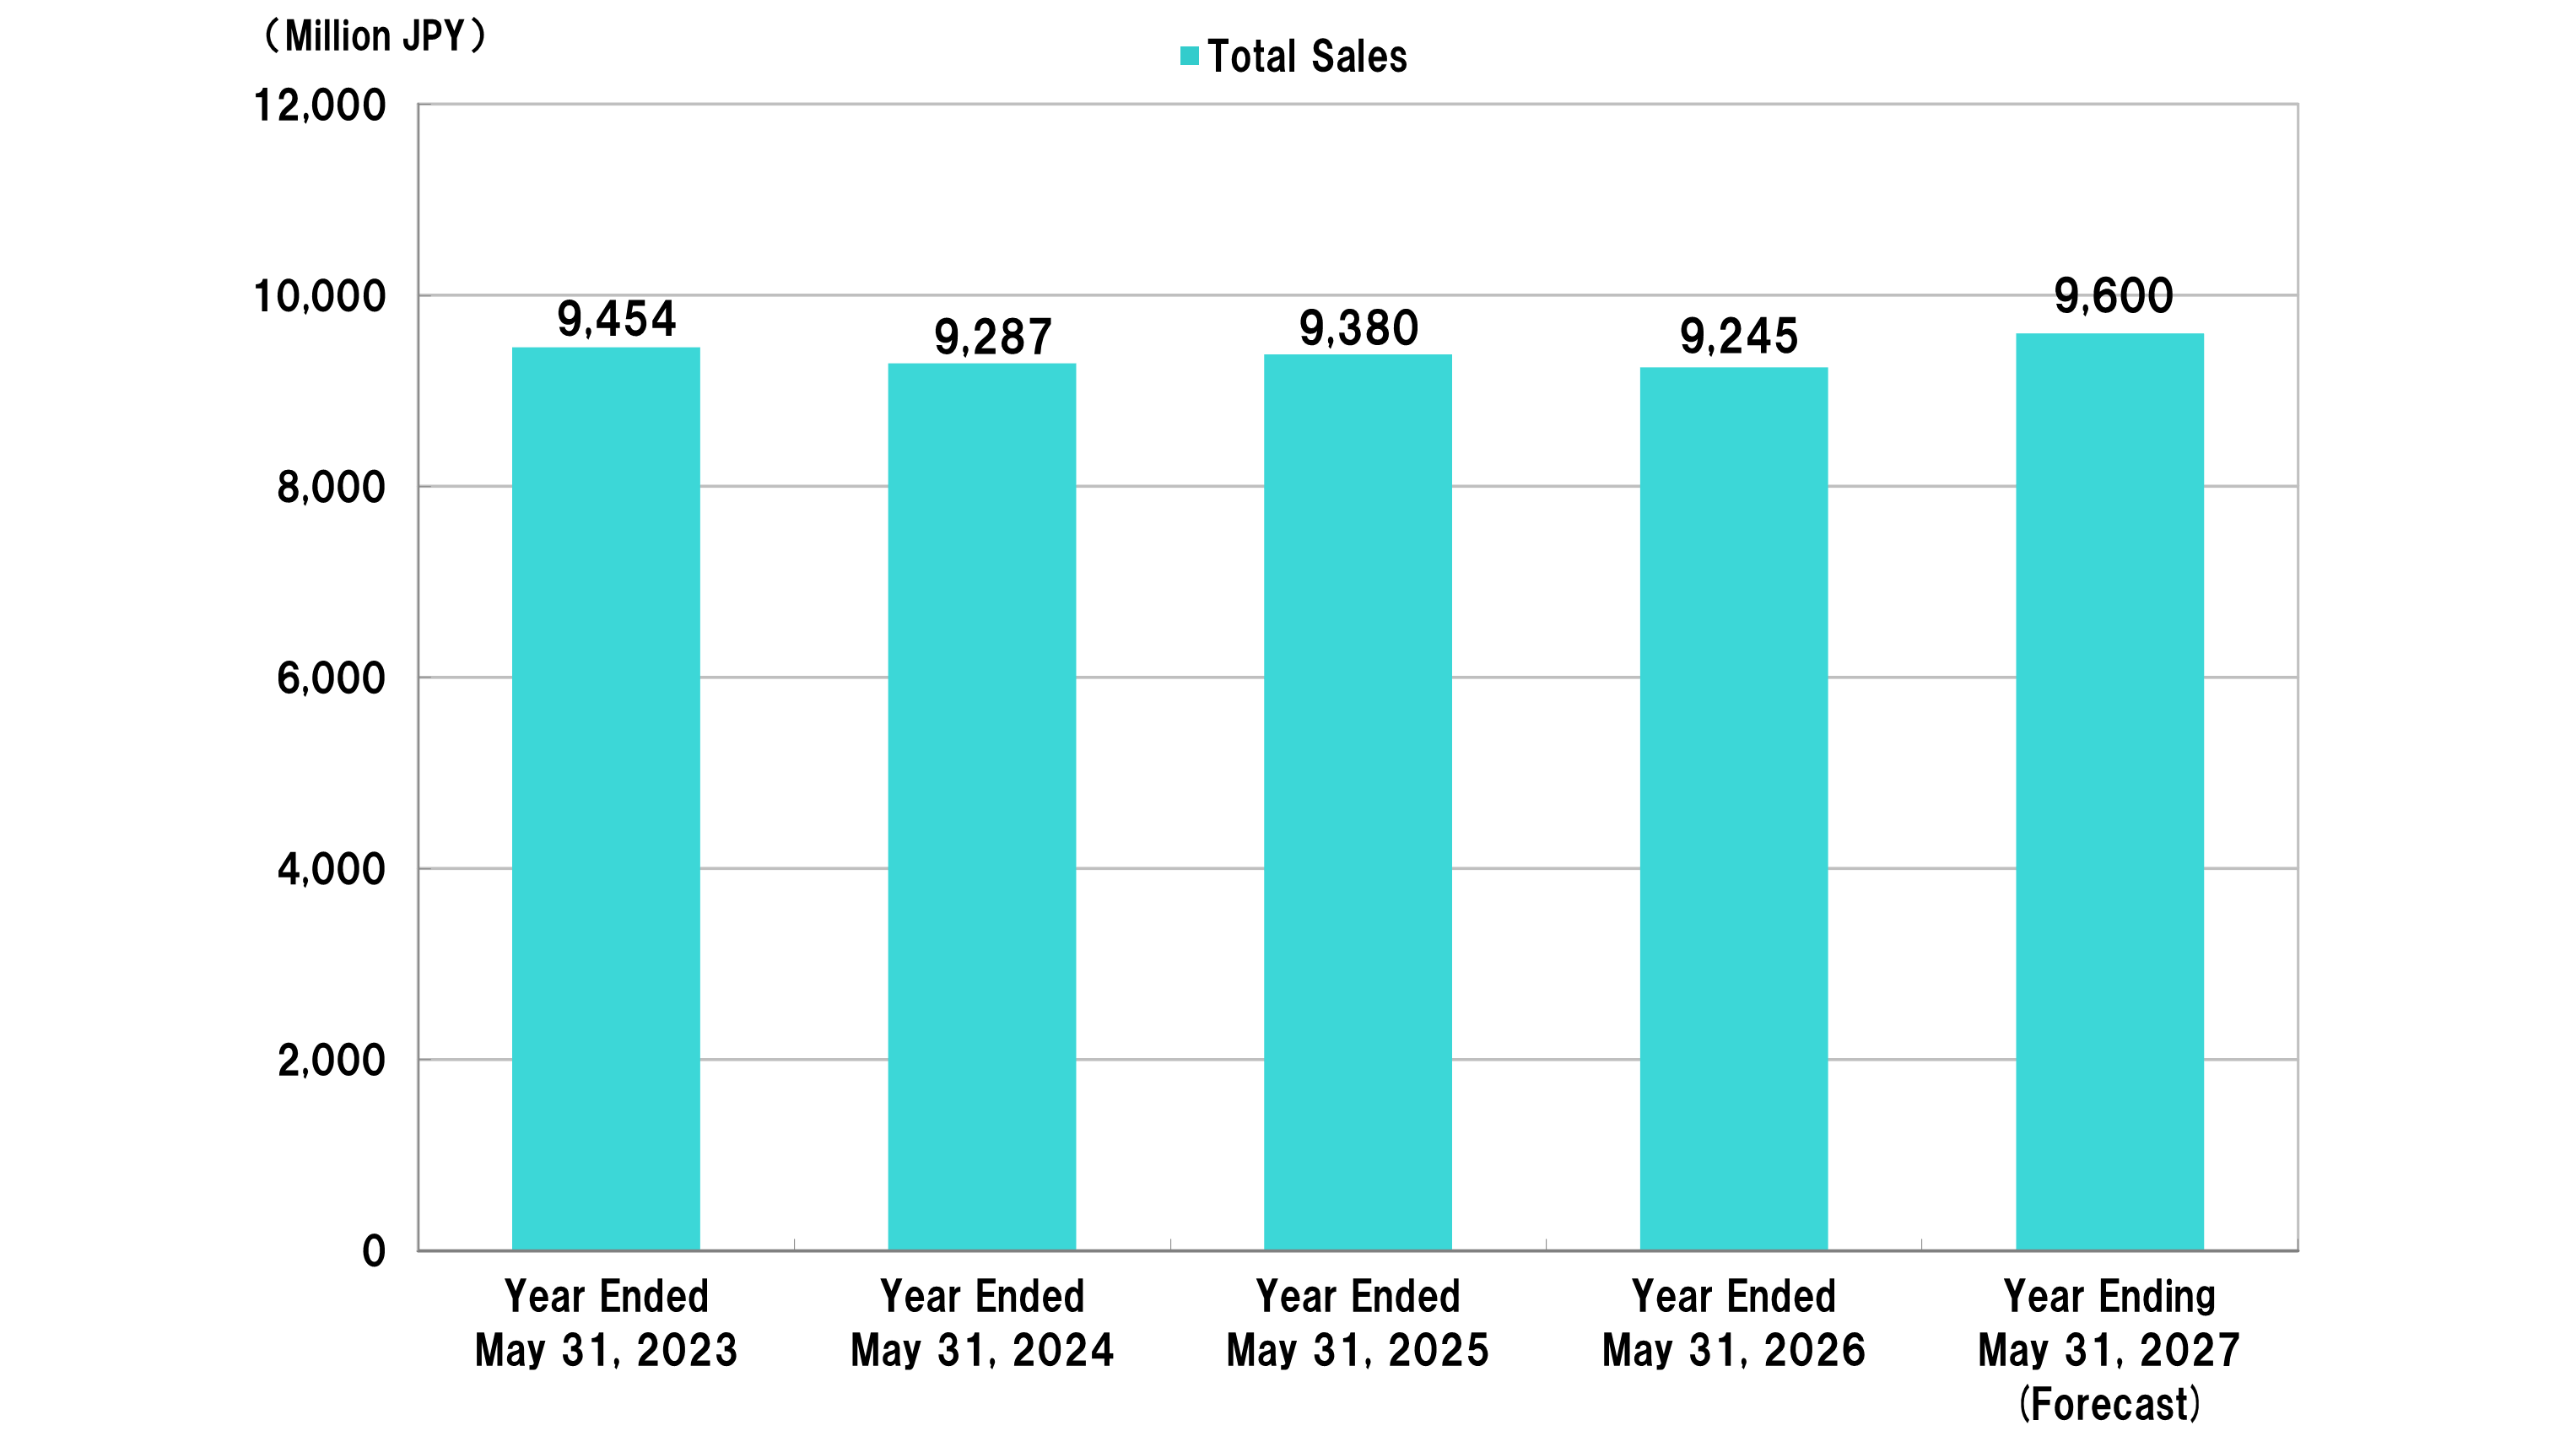
| Total Sales | 9,454 | 9,287 | 9,380 | 9,245 | △1.4% | 9,600 | |
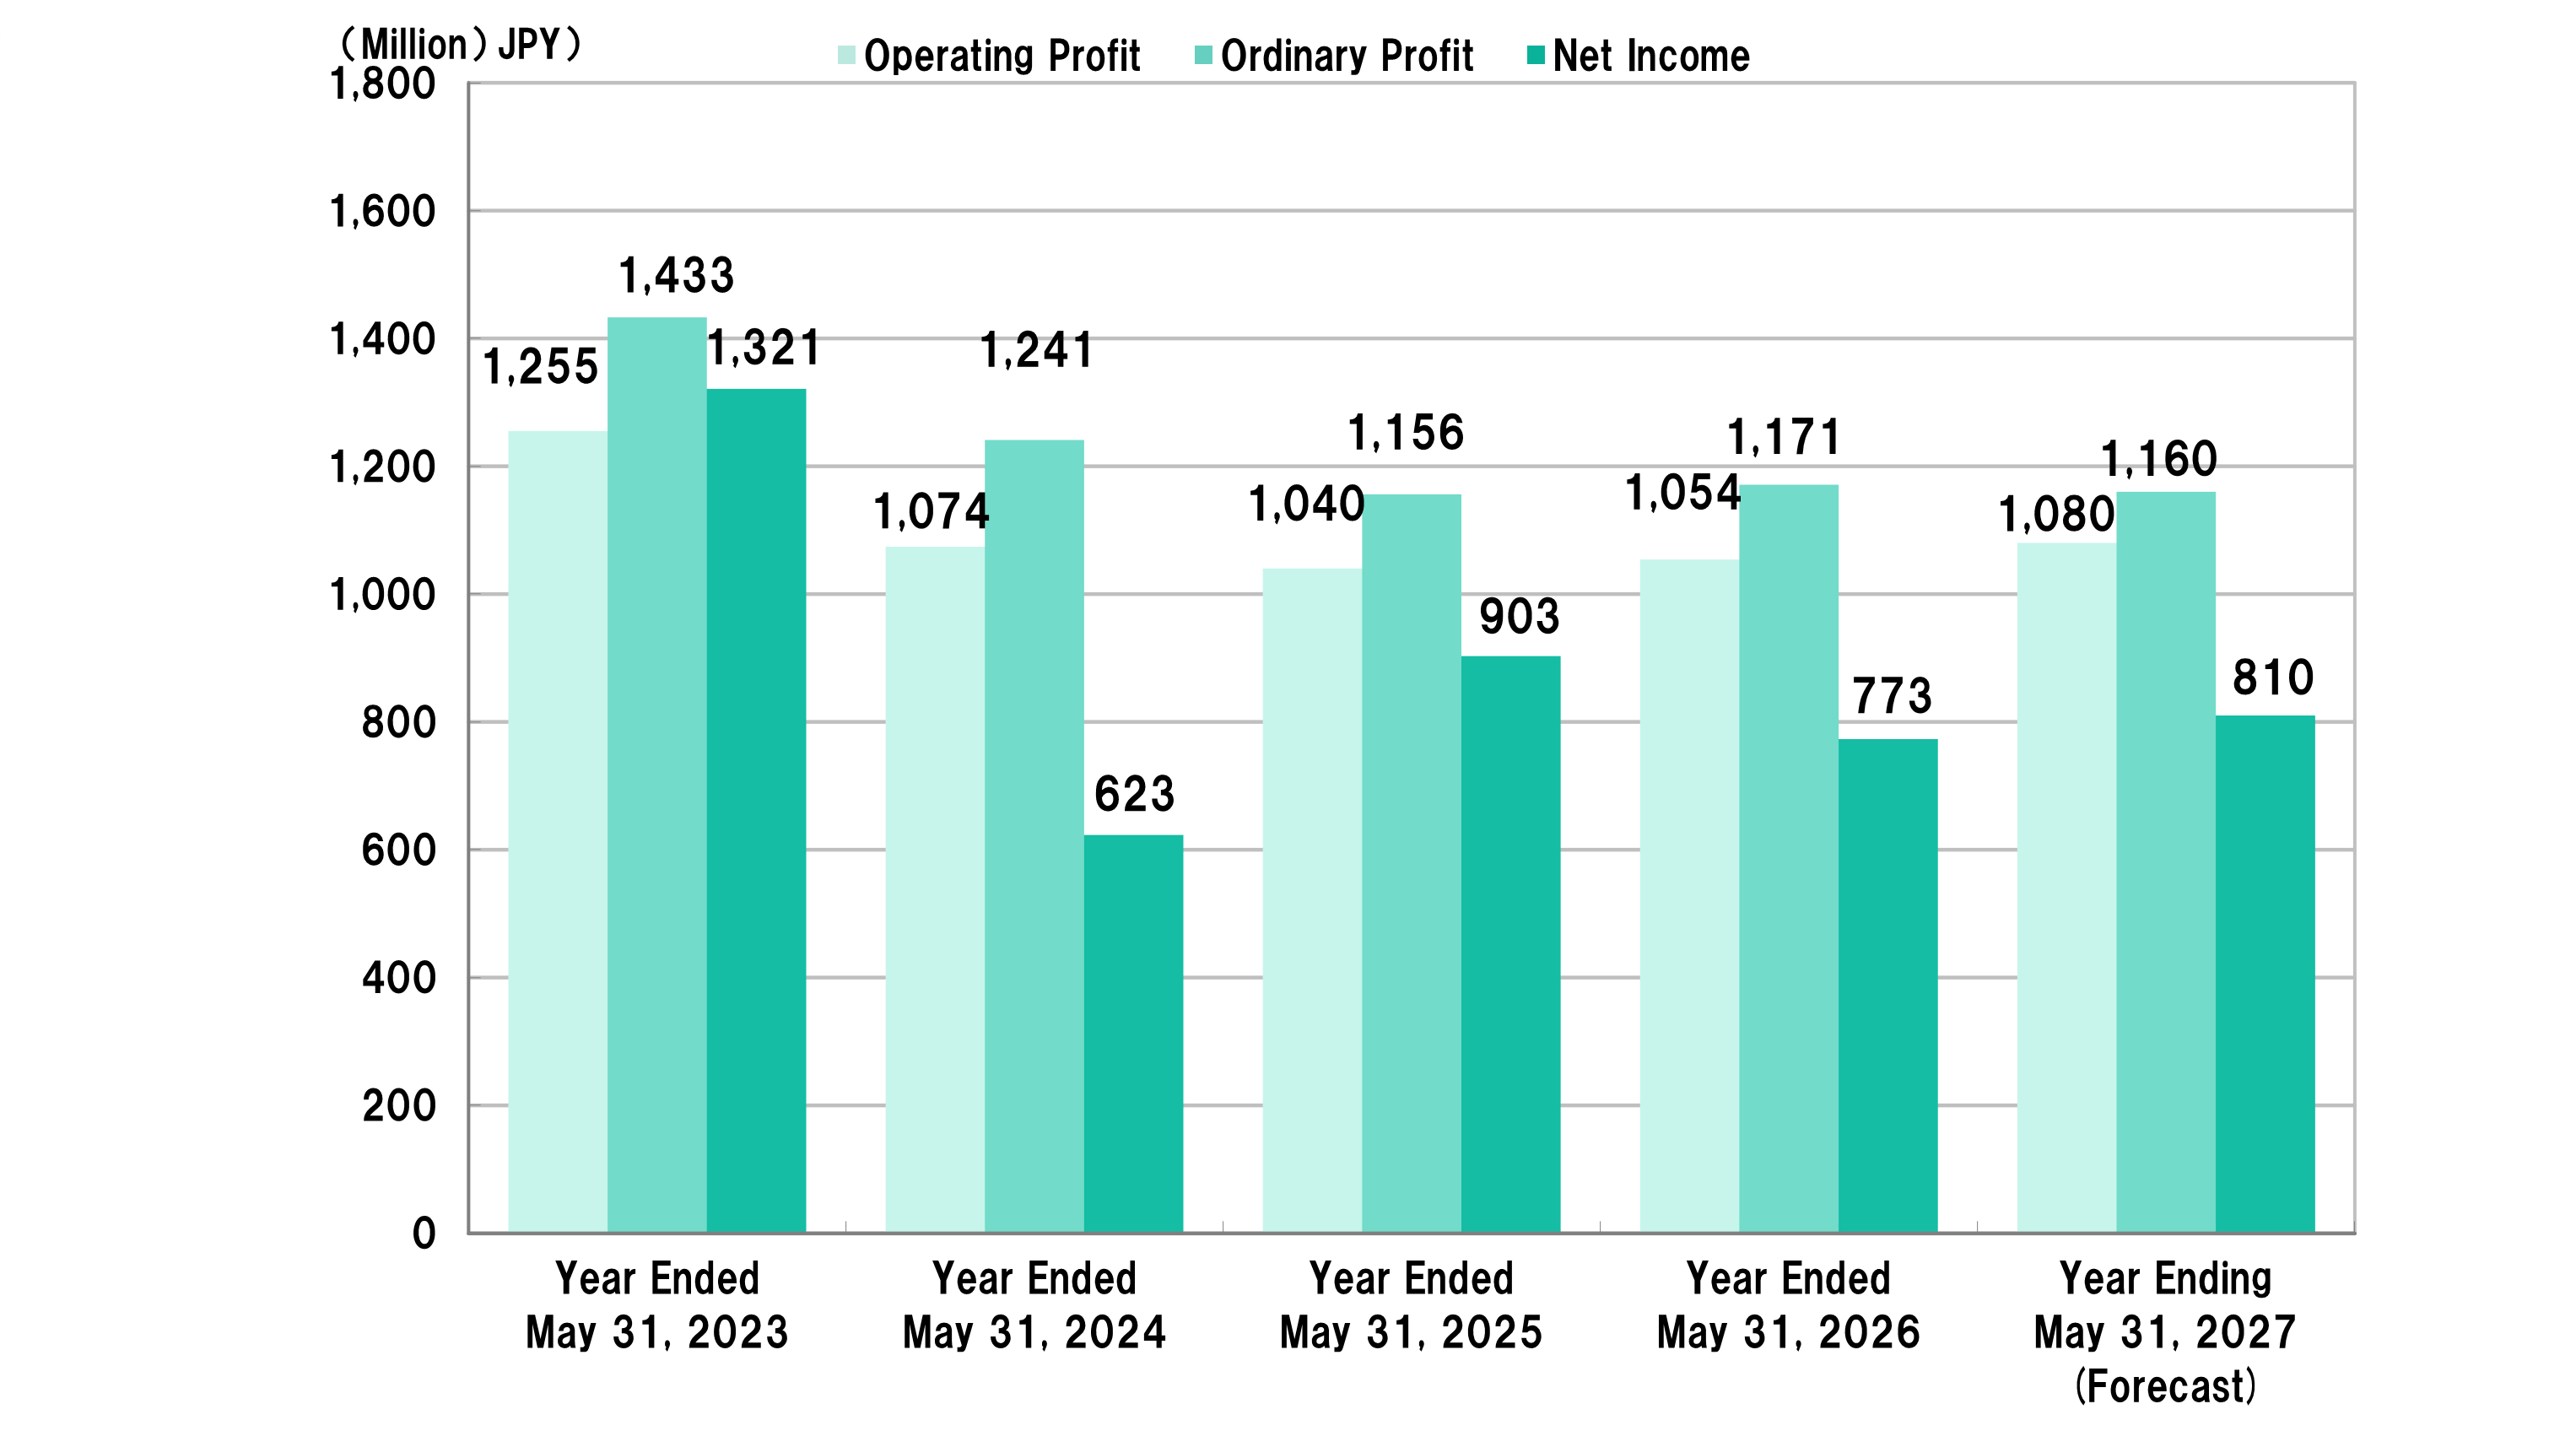
| Operating Profit | 1,255 | 1,074 | 1,040 | 1,054 | 1.3% | 1,080 | |
| Ordinary Profit | 1,433 | 1,241 | 1,156 | 1,171 | 1.3% | 1,160 | |
| Net Income | 1,321 | 623 | 903 | 773 | △14.3% | 810 | |
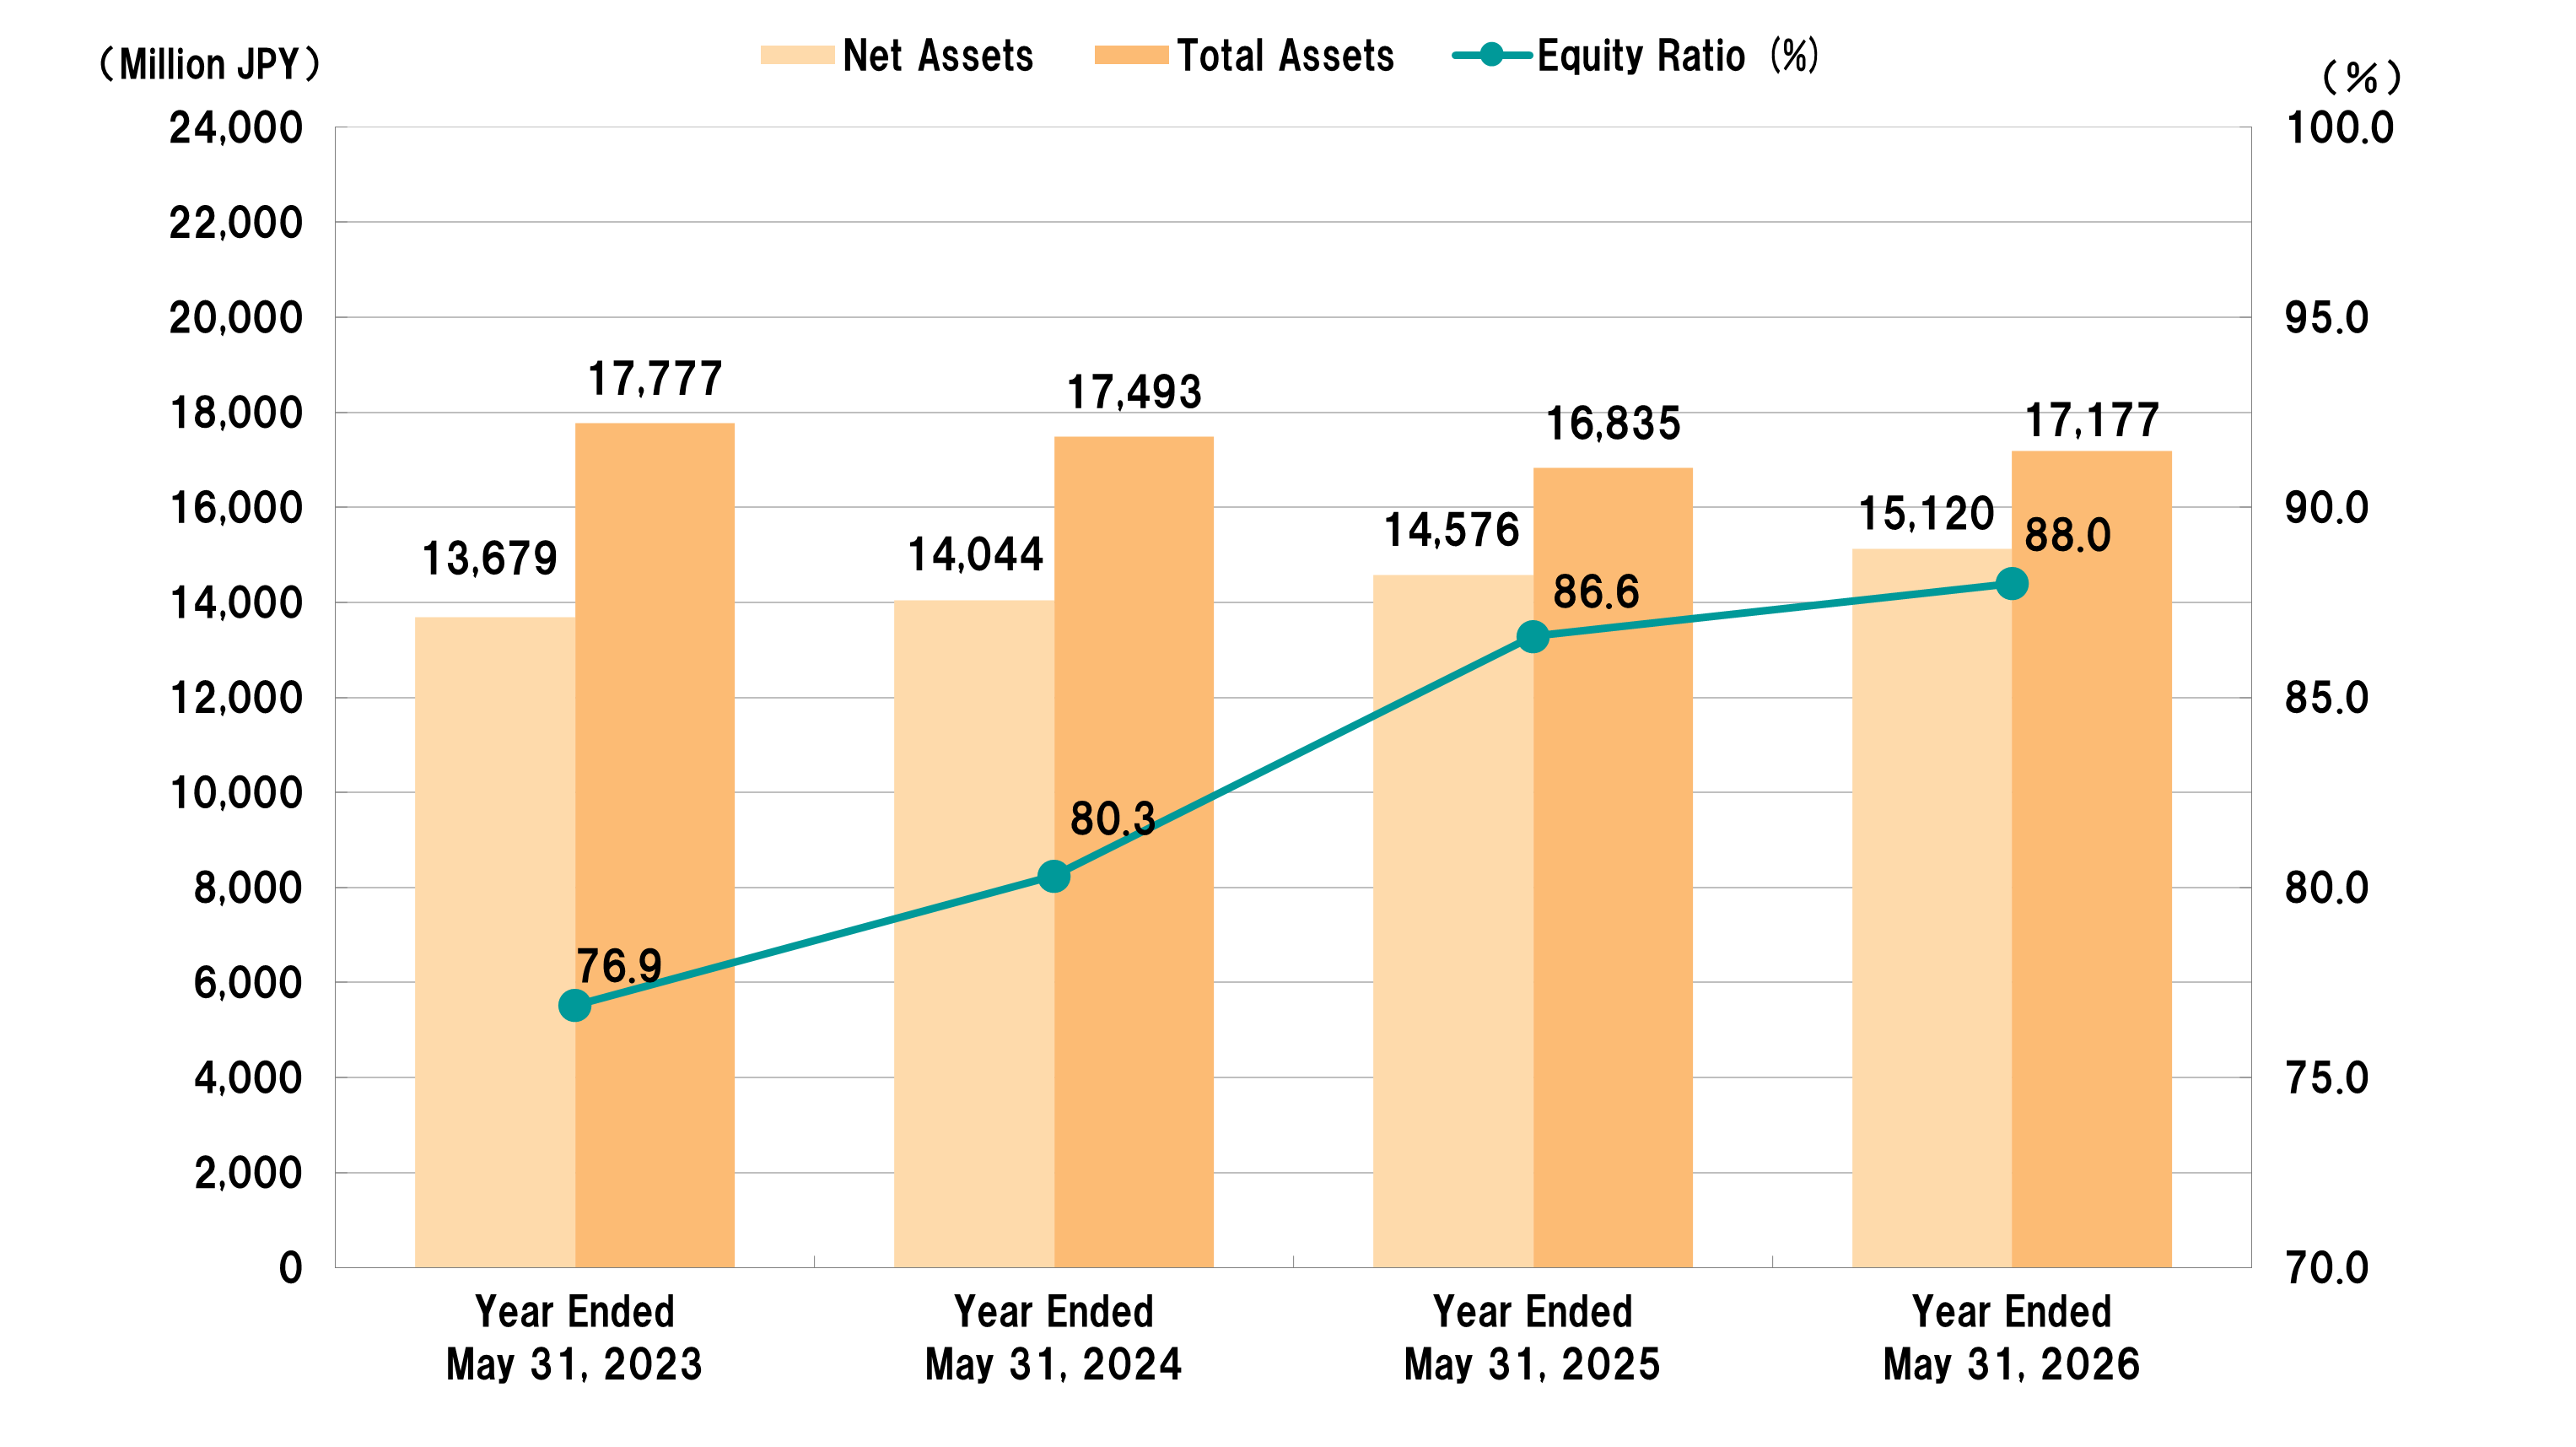
| Net Assets | 13,679 | 14,044 | 14,576 | 15,120 | 3.7% | – | |
| Total Assets | 17,777 | 17,493 | 16,835 | 17,177 | 2.0% | – | |
| Net Assets per Share of Common Stock (JPY) |
1,931.52 | 1,983.01 | 2,058.25 | 2,135.00 | – | – | |
| Net Income per Share of Common Stock (JPY) | 186.54 | 88.04 | 127.56 | 109.29 | – | 114.37 | |
| Equity Ratio (%) | 76.9 | 80.3 | 86.6 | 88.0 | – | – | |
| Return On Equity (%) | 10.0 | 4.5 | 6.3 | 5.2 | – | – | |
Please scroll the table horizontally.
| Compared with the same period in the previous year |
3 Months Ended May 31, 2027 (1st Quarter) |
3 Months Ended May 31, 2026 (1st Quarter) |
6 Months Ended May 31, 2027 (2nd Quarter) |
6 Months Ended May 31, 2026 (2nd Quarter) |
9 Months Ended May 31, 2027 (3rd Quarter) |
9 Months Ended May 31, 2026 (3rd Quarter) |
|
|---|---|---|---|---|---|---|---|
| Total Sales | (Million JPY) | 2,018 | 4,383 | 6,615 | |||
| (%)※ | △4.4 | △3.2 | △6.6 | ||||
| Operating Profit |
(Million JPY) | 157 | 507 | 721 | |||
| (%)※ | △13.4 | 0.7 | △12.1 | ||||
| Ordinary Profit |
(Million JPY) | 209 | 574 | 796 | |||
| (%)※ | △0.4 | 6.3 | △8.0 | ||||
| Quarterly Net Income |
(Million JPY) | 141 | 387 | 531 | |||
| (%)※ | △5.1 | 2.6 | △14.5 | ||||
※(Compared with the same period in the previous year)
Net Sales
Operating Profit / Ordinary Profit / Net Income
Net Assets / Total Assets / Equity Ratio