Non-Consolidated Accounting
Non-Consolidated Accounting
Please scroll the table horizontally.
(Million JPY)
| Year Ended May 31, 2022 | Year Ended May 31, 2023 | Year Ended May 31, 2024 | Year Ending May 31, 2025 | Compared with the same period in the previous year |
Year Ending May 31, 2026 (Forecast) |
||
|---|---|---|---|---|---|---|---|
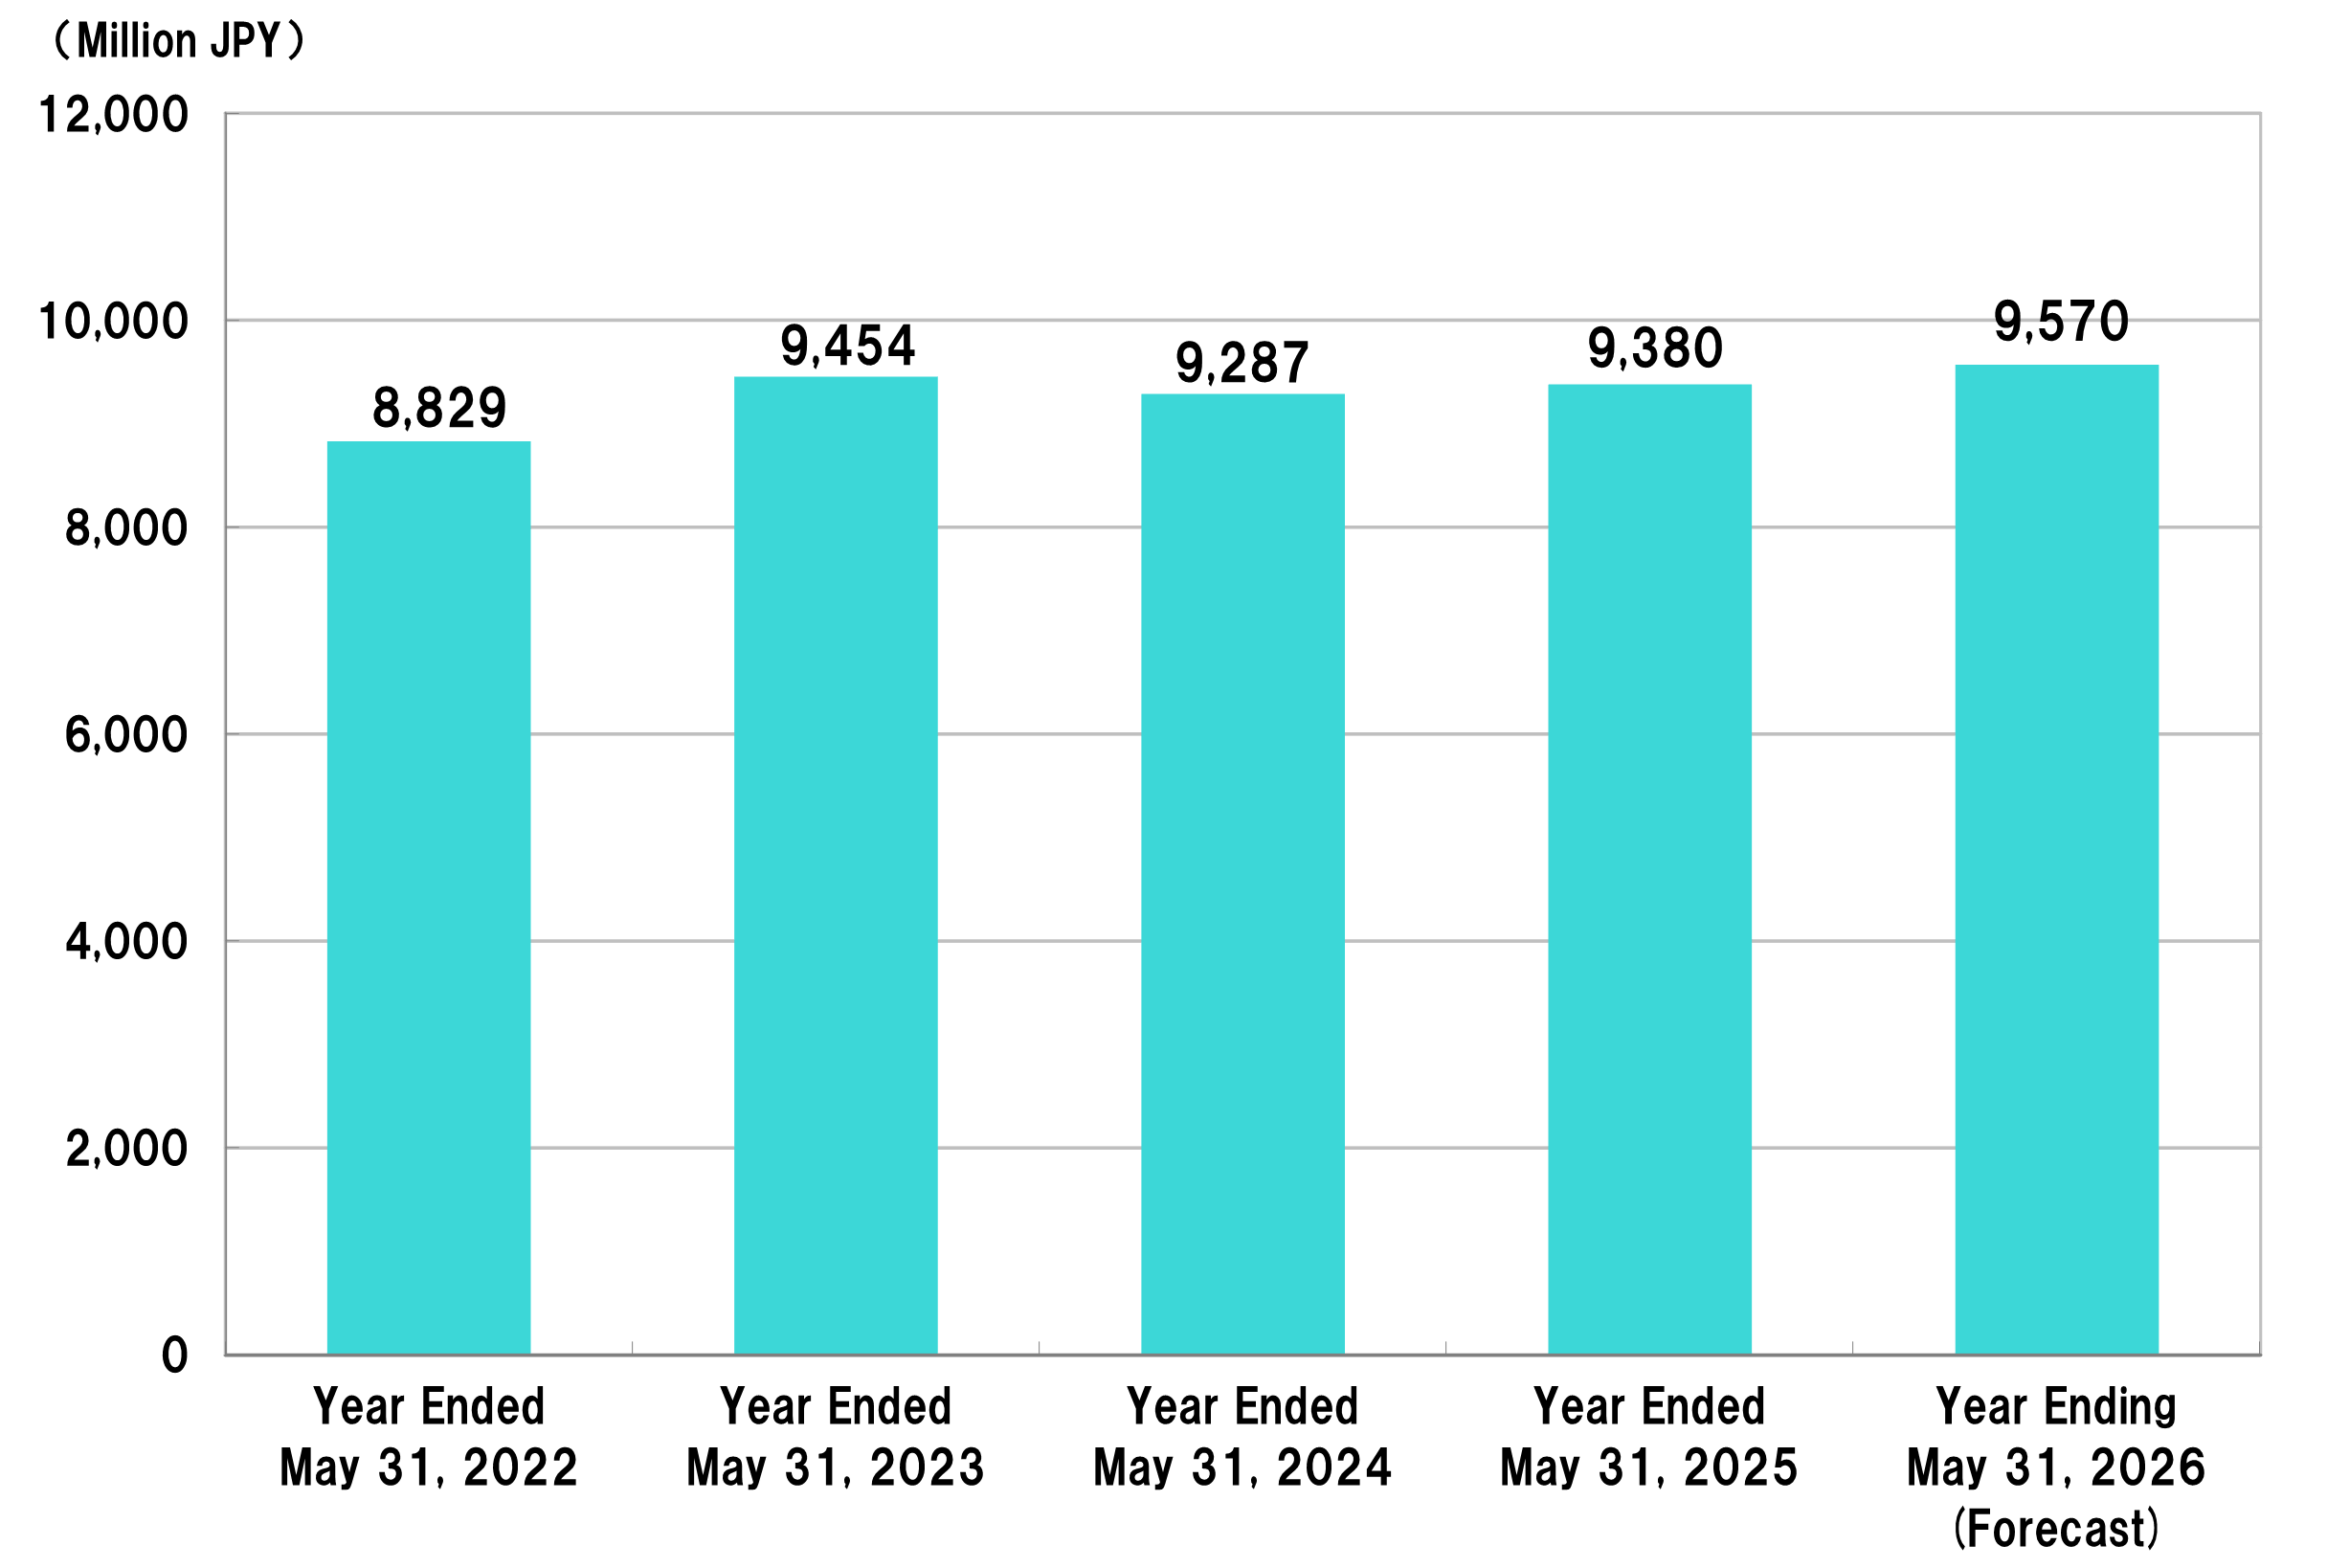
| Total Sales | 8,829 | 9,454 | 9,287 | 9,380 | 1.0% | 9,570 | |
| Operating Profit | 1,262 | 1,255 | 1,074 | 1,040 | △3.2% | 1,040 | |
| Ordinary Profit | 1,401 | 1,433 | 1,241 | 1,156 | △6.9% | 1,135 | |
| Net Income | 1,032 | 1,321 | 623 | 903 | 44.9% | 775 | |
| Net Assets | 12,703 | 13,679 | 14,044 | 14,576 | 3.8% | – | |
| Total Assets | 15,989 | 17,777 | 17,493 | 16,835 | △3.8% | – | |
| Net Assets per Share of Common Stock (JPY) |
1,793.67 | 1,931.52 | 1,983.01 | 2,058.25 | – | – | |
| Net Income per Share of Common Stock (JPY) | 145.77 | 186.54 | 88.04 | 127.56 | – | 109.43 | |
| Equity Ratio (%) | 79.4 | 76.9 | 80.3 | 86.6 | – | – | |
| Return On Equity (%) | 8.3 | 10.0 | 4.5 | 6.3 | – | – | |
Please scroll the table horizontally.
| Compared with the same period in the previous year |
3 Months Ended May 31, 2026 (1st Quarter) |
3 Months Ended May 31, 2025 (1st Quarter) |
6 Months Ended May 31, 2026 (2nd Quarter) |
6 Months Ended May 31, 2025 (2nd Quarter) |
9 Months Ended May 31, 2026 (3rd Quarter) |
9 Months Ended May 31, 2025 (3rd Quarter) |
|
|---|---|---|---|---|---|---|---|
| Total Sales | (Million JPY) | 2,018 | 2,110 | 4,383 | 4,530 | 7,080 | |
| (%)※ | △4.4 | △9.0 | △3.2 | △4.3 | 1.8 | ||
| Operating Profit |
(Million JPY) | 157 | 182 | 507 | 504 | 820 | |
| (%)※ | △13.4 | △28.1 | 0.7 | △13.8 | △0.1 | ||
| Ordinary Profit |
(Million JPY) | 209 | 209 | 574 | 540 | 865 | |
| (%)※ | △0.4 | △38.9 | 6.3 | △21.0 | △7.3 | ||
| Quarterly Net Income |
(Million JPY) | 141 | 149 | 387 | 377 | 621 | |
| (%)※ | △5.1 | △39.2 | 2.6 | △21.8 | 8.8 | ||
※(Compared with the same period in the previous year)
Net Sales
Operating Profit / Ordinary Profit / Net Income

Net Assets / Total Assets / Equity Ratio